Article Text

Abstract
Background Rapid scale-up of effective antiretroviral therapy (ART) is required to meet global targets to eliminate new HIV infections and AIDS-related deaths. Yet, gaps persist in all nations striving for these targets. In the intervention setting of British Columbia (BC), Canada, where ART is publicly funded, 73% of HIV-diagnosed were on ART in 2011, and only 49% were achieving viral suppression.
Methods An observational case descriptive study of HIV care sites in BC recruited to participate in a 35-month Breakthrough Series Quality Improvement Collaborative and sustainability network. Sites collected four quality indicators, qualitative change descriptions and implemented the chronic care model (CCM) and HIV care and treatment guidelines. Two reviewers assigned monthly implementation scores to evaluate site progress (January 2011–2012). All quality indicators were pooled and analysed using probability-based run chart rules.
Results Seventeen teams with a pooled median population of 2296 HIV patients joined the initiative. Comprehensive CCM implementation and evidence of improvement was achieved by 29% of sites (implementation score of 4.0 or higher on 5.0 scale). Evidence of sustained improvement was observed for patient engagement (88.8–90.4%), ART uptake among patients unequivocally in need (92.9–94.8%), and ART uptake (≥6 months) and achieving viral suppression (57.3–78.4%) (all p<0.05).
Conclusions This study shows evidence of sustained improvements in HIV care processes and treatment outcomes for an estimated population of 2296 HIV patients in 17 BC sites. Overall success points to opportunities for other high-income countries seeking to improve HIV health outcomes.
- Collaborative, breakthrough groups
- Quality improvement
- Chronic disease management
- Primary care
- Control charts, run charts
Statistics from Altmetric.com
- Collaborative, breakthrough groups
- Quality improvement
- Chronic disease management
- Primary care
- Control charts, run charts
Introduction
Rapid scale-up of effective antiretroviral therapy (ART) is required to meet global targets to eliminate new HIV infections and HIV-related morbidity and mortality.1–4 The Joint United Nations Programme on HIV and AIDS, or UNAIDS, is calling on all nations to reach ambitious targets by 2020 to ensure 90% of HIV-infected persons are diagnosed, 90% are on treatment and 90% are on treatment and achieving viral suppression.5
In high-income countries where ART may be more widely available through established healthcare systems, gaps persist. The United States Centers for Disease Control has reported that of the 1.2 million HIV-diagnosed in the USA, only 37% were prescribed ART and 30% were achieving viral suppression in 2011.6 In the intervention setting of British Columbia (BC), Canada, where ART is publicly funded, 73% of the 8308 HIV-diagnosed were on ART in 2011 and 49% were achieving viral suppression.7
An effective and organised health system that delivers coordinated care across the HIV continuum is emphasised in the literature as key to closing gaps in care processes and treatment outcomes.8 ,9 Current BC and WHO guidelines recommend early HIV diagnosis and rapid linkage to care with early ART initiation and support for lifelong ART adherence and engagement in care.1 For these improvements, the chronic care model (CCM) has been cited as an important organising framework.10 ,11
Quality Improvement Collaborative (QIC) methodology has been used extensively in health systems to close gaps between current practice and best practice.12–15 Two systematic reviews have found positive but limited evidence in support of the impact of QIC methodology,13 ,14 and findings point to gaps in the literature relating to characterisation of factors contributing to team progress, effects on patient outcomes and sustainability of intervention outcomes.12–15 Similarly, evidence of QIC effectiveness focusing on HIV care and processes is generally positive but limited. To illustrate, Landon et al16 found an 11% increase in viral suppression rates in a US-based QIC, though results were not statistically significant compared with the control group. Other studies have reported increases in monthly ART initiation rates,17 greater uptake of best practices for reducing HIV mother-to-child transmission18 and a variety of strategic changes supporting quality of HIV and chronic illness care.19
We report on a 14-month Breakthrough Series QIC with 21 months of sustainability programming delivered in 17 diverse BC sites with the shared aim to improve HIV care and treatment outcomes by implementing the six domains of the CCM. Primary outcomes of interest included patient engagement in care, evidence-based clinical care monitoring, viral suppression among patients on treatment and team progress in implementing the CCM and achieving improvements for quality indicators.
Methods
Setting
BC is the most western Canadian province with a population of 4.4 million (2011 census).20 In 2011, there were 8308 HIV-diagnosed persons living in BC; 7801 linked to care (94%), 5975 on ART (73%) and 4054 achieving viral suppression (49%).7 National surveillance estimates in 2011 calculated the BC HIV prevalence rate to be 265.9 per 100 000.21 This is considered a concentrated epidemic with HIV infection disproportionately affecting several key populations including men who have sex with men, people who use injection drugs, sex workers and indigenous people of BC.22
Health system organisation
Many aspects of the BC healthcare system are funded publicly through taxation and other revenue sources.23 The BC Ministry of Health sets direction, monitors results and disburses funds to five regionally defined Health Authorities that are responsible for delivering services to meet population health needs in their respective regions.23 Two additional Health Authorities manage population or programme-specific services. The Ministry of Health also funds preapproved prescription drugs with full coverage for a wide range of ARTs. HIV care and treatment is essentially free of cost at the point of care and provincial ART guidelines are consistent with International Antiviral Society—USA Guidelines.1
Context
With mounting evidence that ART scale-up was resulting in significant decreases in HIV-related morbidity, mortality and transmission,3 ,4 ,24–26 as well as cost-effectiveness studies demonstrating the cost savings from greater ART uptake,25 ,27 ,28 the government of BC responded by launching a 48 million dollar 4-year pilot project to increase HIV testing and treatment in two urban BC sites; Vancouver inner city and Prince George. The pilot became known as Seek and Treat for Optimal Prevention of HIV/AIDS (STOP HIV/AIDS), and given the potential of QIC methodology to address deficiencies in evidence-based care provision, funds were allocated to launch a QIC intervention in December 2010.
Intervention components
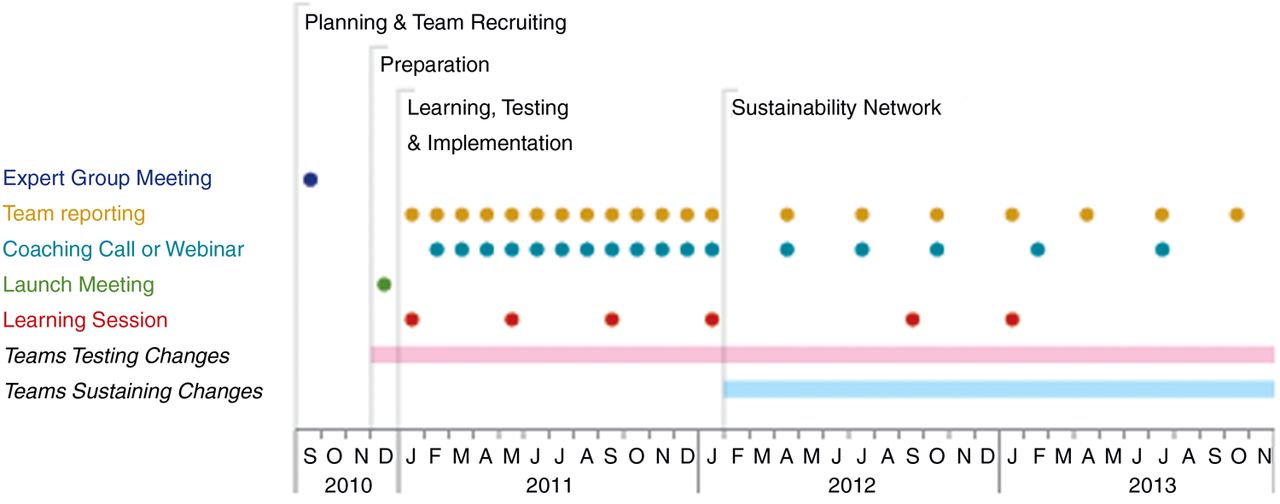
The STOP HIV/AIDS QIC followed the Institute for Healthcare Improvement's Breakthrough Series Collaborative methodology from December 2010 to January 2012 (14 months), described in figure 1.29 The QIC adopted the shared aim to improve HIV care and treatment outcomes by implementing the six domains of the CCM. All teams were encouraged to adopt the stretch targets: 95% engaged in care; 95% with a plasma viral load (pVL) test every four months; 95% on ART among those unequivocally in need; and 95% on ART (for ≥6 months) and achieving viral suppression. Beginning in January 2012, teams were invited to sustain their gains in the sustainability network, a less intensive QIC model.

Quality Improvement Collaborative component timeline.
The BC Centre for Excellence in HIV/AIDS—a provincial resource for HIV/AIDS care, treatment, education, research and evidence-based policy development—provided intervention leadership and coordination with quality improvement support from ImpactBC, a Vancouver-based not-for-profit dedicated to patient engagement in health system improvement. The costs of delivery were borne by the BC Centre for Excellence in HIV/AIDS using STOP HIV/AIDS pilot project funds. Costs of delivery included learning sessions, QIC staffing and travel to visit each team site once. Health Authorities covered staff participation costs including travel to learning sessions and backfill for participation.
Planning and team recruitment
In September 2010, a diverse, multi-stakeholder expert group meeting was convened to define technical materials including shared aims, quality indicators and change concepts. Participant representation was inclusive of all Health Authority regions and varied health disciplines including clinical, administrative, quality and community. Health Authority leaders were contacted with an offer of invitation to select and support sites to participate. Site selection criteria were provided to assist in selecting teams capable of contributing to shared aims, collecting indicators and implementing suggested changes (see online supplementary appendix 1).
Launch and preparation
A launch session was held in December 2010 to orient sites to shared aims, expectations and preparations. With guidance from technical materials, sites formed improvement teams and drafted improvement charters. Teams initiated quality indicator collection by reviewing HIV patient records and creating registries. All teams were supplied with a document listing changes aligned with CCM concepts, with specific examples drawn from evidence and expert member experience (see online supplementary appendix 1). Teams used local knowledge and locally defined aims to select among changes.
Learning, testing and implementation
Learning sessions were held every 3–4 months convening team representatives in Vancouver. Attendees learned about quality improvement methods, HIV guidelines and the CCM. Participants shared progress, results and planned for future tests of change.
Between learning sessions, teams used Plan-Do-Study-Act (PDSA) cycles to test and implement selected changes and reported monthly quality indicators and qualitative descriptions of changes. Teams were supported to improve with monthly coaching calls, a website of resources and targeted monthly team feedback focusing on improvement, change techniques and matching teams working on similar changes.
QIC staff met with Health Authority team leadership approximately twice annually to share team progress reports. Discussion focused on highlighting improvement processes, support for teams and team-reported barriers and challenges.
Sustainability network
In January 2012, the QIC transitioned to a sustainability network where participants were encouraged to continue to report quality indicators and narrative on a quarterly basis and participate in two additional learning sessions. Teams were supported with ongoing coaching calls and feedback. Leadership and coordination remained with the BC Centre for Excellence in HIV/AIDS and a diverse eight-member team of QIC participants was created to plan and deliver sustainability network activities including two learning sessions, quarterly webinars and quarterly reporting with individualised feedback (figure 1).
Evaluation
Quality indicator data
Teams reported monthly numerical quality indicators and qualitative descriptions of changes from January 2011 to January 2012 and then on a quarterly basis from January 2012 to October 2013. The rate of team participation in reporting was calculated by dividing the total number of times a team reported by 19, the maximum number of reporting periods between January 2011 and October 2013.
Quality indicators were based on 2008 International Antiviral Society—USA guidelines,30 current at the time of indicator development and included three process indicators—(1) engaged in care (proportion of HIV patients with at least two primary care visits, 60 days apart or more, in the previous 12 months); (2) pVL testing every four months (proportion of HIV patients with a pVL test every four months); (3) ART uptake among those unequivocally in need (proportion of HIV patients on ART among those with a lifetime CD4 cell count <200 copies/mL)—and one outcome indicator: (4) ART uptake for ≥6 months and achieving viral suppression (proportion of HIV patients on ART for ≥6 months and with a pVL <200 copies/mL at last measure). Notably, the threshold value for a suppressed viral load was set at 200 copies/mL to align with the sensitivity of the viral load assay at the time of the intervention. It is also important to note that indicator 3 was defined in November 2010 when guidelines called for treatment in those with a CD4 cell count <200 copies/mL. While evidence in favour of earlier treatment was emerging, the indicator was adopted at the guideline-based level current at the time of definition based on expert group consensus.
Implementation scores
From January 2011 to 2012, teams were assigned a monthly implementation score as a measure of progress in meeting improvement aims and implementing changes. Scores ranged from 0.5 (no activity) to 5.0 (outstanding sustainable results) based on adapted Collaborative Assessment Scale criteria developed by the Institute for Health Care Improvement (see online supplementary appendix 2).31
Implementation scores were determined in a process involving two reviewers. Reviewers divided up monthly team reports (inclusive of quality indicators and qualitative descriptions of changes) and independently applied score criteria to arrive at a preliminary score. To build inter-rater reliability, reviewers met monthly to discuss score assignments and decided final team implementation scores by consensus.
Quality indicator analysis
Quality indicators were inspected for evidence of improvement by pooling monthly team data and plotting the arithmetic mean in run charts. Run charts are a widely accepted tool for interpreting improvement data where improvement is planned and expected.32–34 Run charts are also recommended for interventions with ≤20 data observations.34
Analysis of run charts proceeded according to methods and definitions described by Provost and Murray.34 A baseline median was constructed with the first 10 data points (January 2011–October 2011) and used to inspect for run chart rules (RCR).34 Three RCRs (RCR 1–3) are probability-based, predefined data patterns; patterns that are unlikely to occur by chance in the absence of change or improvement, based on an alpha error of p<0.05.32 ,34 ,35 The presence of only one of these is needed to provide evidence of a change or improvement.32 ,34 ,35 Where a signal of improvement was indicated by RCR 1–3, a new median was constructed to represent the new level of performance.34 The fourth rule (RCR 4) describes an astronomical point, which is a judgement-based rule, not determined by a pattern. As such, this rule does not provide evidence of improvement; rather, it may be useful for learning.
Results
Participant characteristics
Seventeen diverse healthcare delivery sites with a pooled median population of 2296 HIV patients joined the initiative. Sites included 11 community health centres; two public health and primary care-focused teams; two HIV specialist clinics situated in hospital settings; one private primary care practice and one nursing-focused HIV support programme.
Participating sites were primarily located in STOP HIV/AIDS pilot funded regions (71%) and situated in or near the largest urban centre of Vancouver (59%), followed by other urban centres (18%), and sites located in mixed urban, rural and remote areas (23%).
All sites formed interdisciplinary improvement teams with key staff types at each site (eg, nurses, physicians, social workers, managers, medical office assistants). Two sites (12.5%) were successful in adding a patient to participate on their improvement team.
All teams crafted site-specific aims aligned with the shared aims and their local population health needs and organisational mandates. Two teams crafted additional quality indicators. All teams selected among suggested changes (summarised in online supplementary appendix 1) for testing (using PDSA cycles) and implementation.
Fidelity to QIC components
While the QIC adhered closely to Breakthrough Series Collaborative methodology, small adaptions were accepted to encourage interdisciplinary participation and local customisation. Specifically, team selection criteria were waived for any team capable of aligning themselves with the shared aims. Also, all teams received organisational support for quality improvement coaching, though the type and intensity of support varied between teams. Variation was also observed in the rigour with which each team adhered to the PDSA approach to testing. Finally, the 21 months of sustainability network programming is a modification of the short-term, time-limited Breakthrough Series Collaborative methodology.
Implementation scores
Of the 17 participating teams, 14 were assigned a monthly implementation score. Three teams did not receive an implementation score because they could not provide specific information needed to apply the score criteria (patient population was either too small for confidential data reporting or the team had created individualised indicators with new definitions).
Median implementation scores rose from 1.0 (SD=0.38) in January 2011 to 3.3 (SD=0.85) in January 2012 (figure 2). Final scores revealed 14% of teams progressed to a highest score of 2.0 (activity, but no changes), 7% to 2.5 (changes tested), 29% to 3.0 (modest improvement), 21% to 3.5 (improvement in outcomes), 7% to 4.0 (significant improvement) and 21% to 4.5 (sustainable improvement).
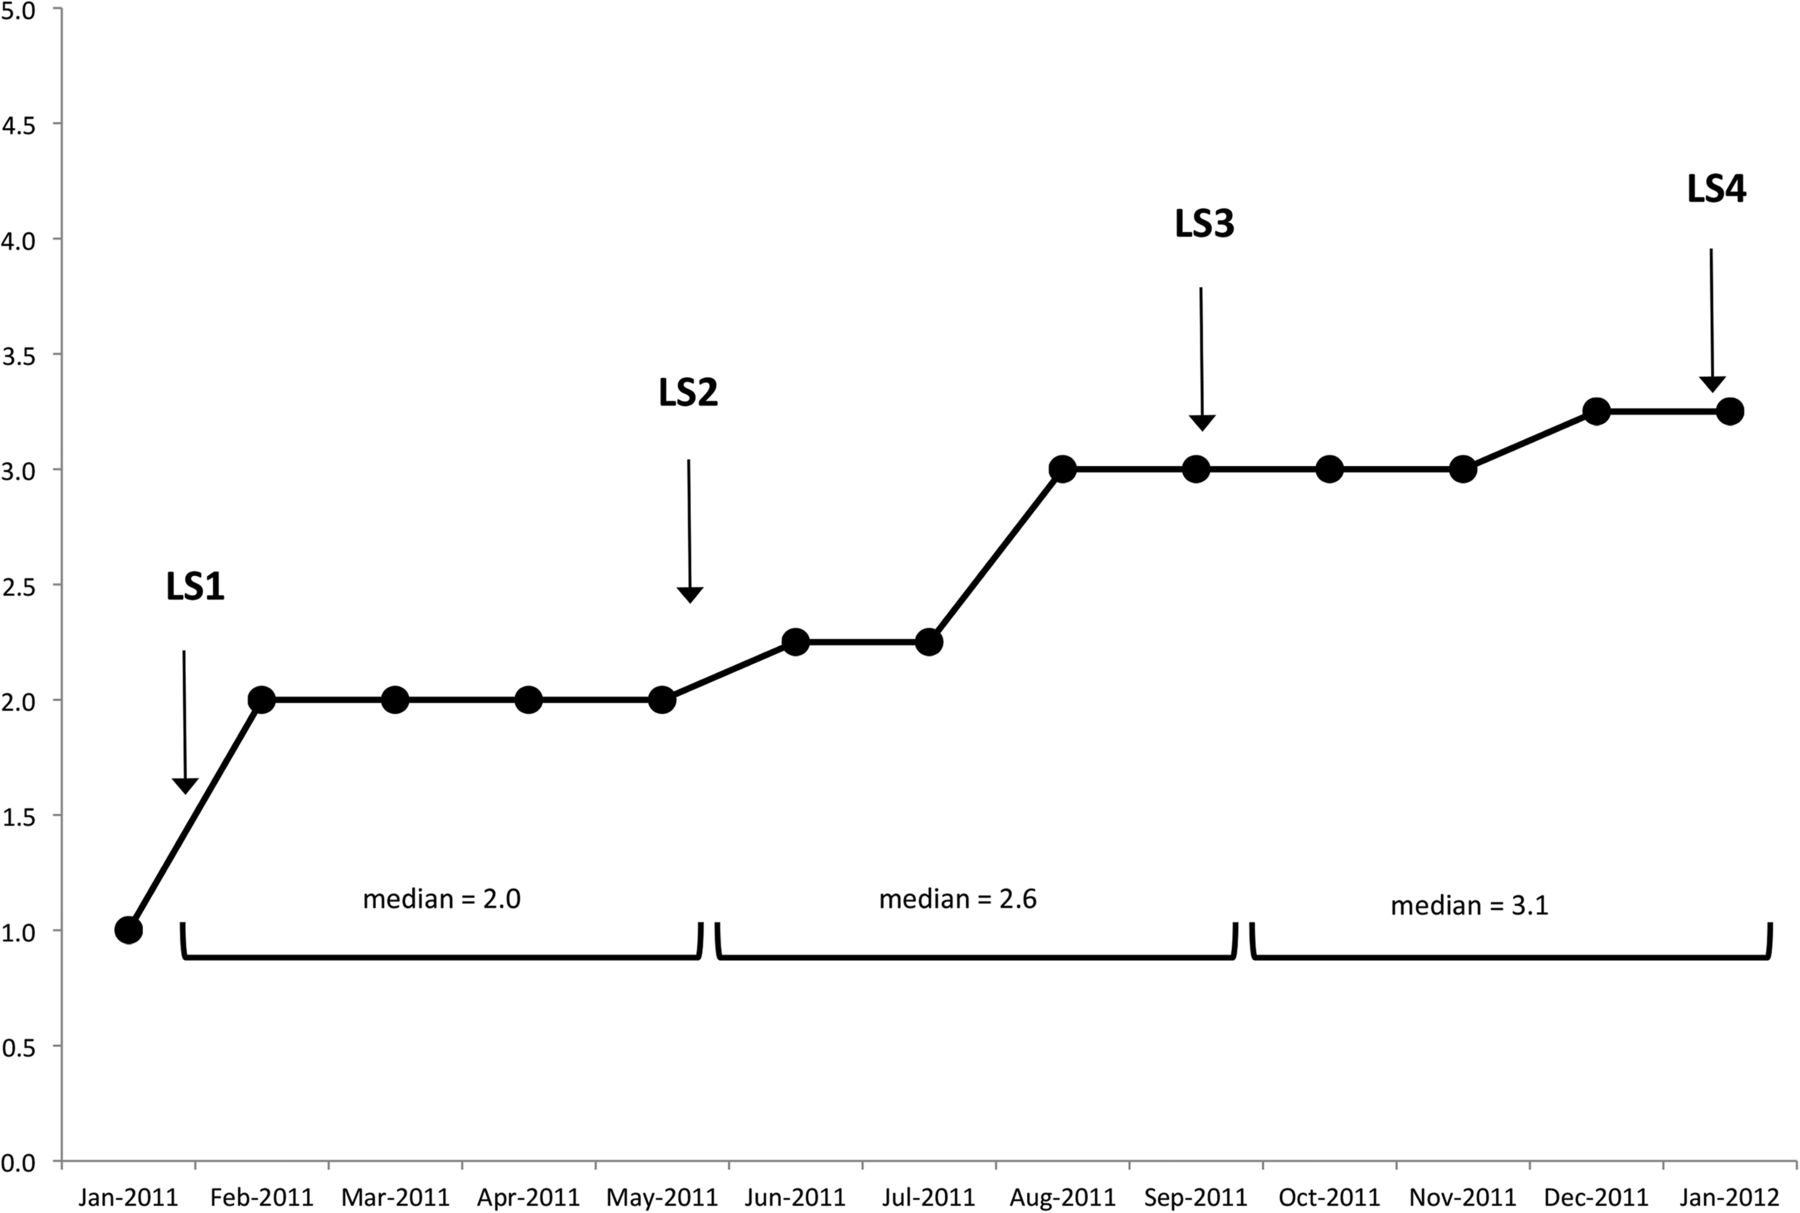
Median pooled team implementation scores (n=14 teams).
Quality improvement indicators
Team reporting rate
A total of 16 teams reported improvement data for indicators 1 (engaged in care) and 2 (pVL testing every four months). The median reporting rate for these indicators was found to be 87% and ranged from 21% to 100%. A total of 15 teams reported improvement data for indicators 3 (ART uptake among those unequivocally in need) and 4 (ART uptake for ≥6 months and achieving viral suppression). A median reporting rate of 84% was observed for these indicators with the rate of reporting ranging from 16% to 100% and 5% to 100% for indicators 3 and 4, respectively.
Engaged in care
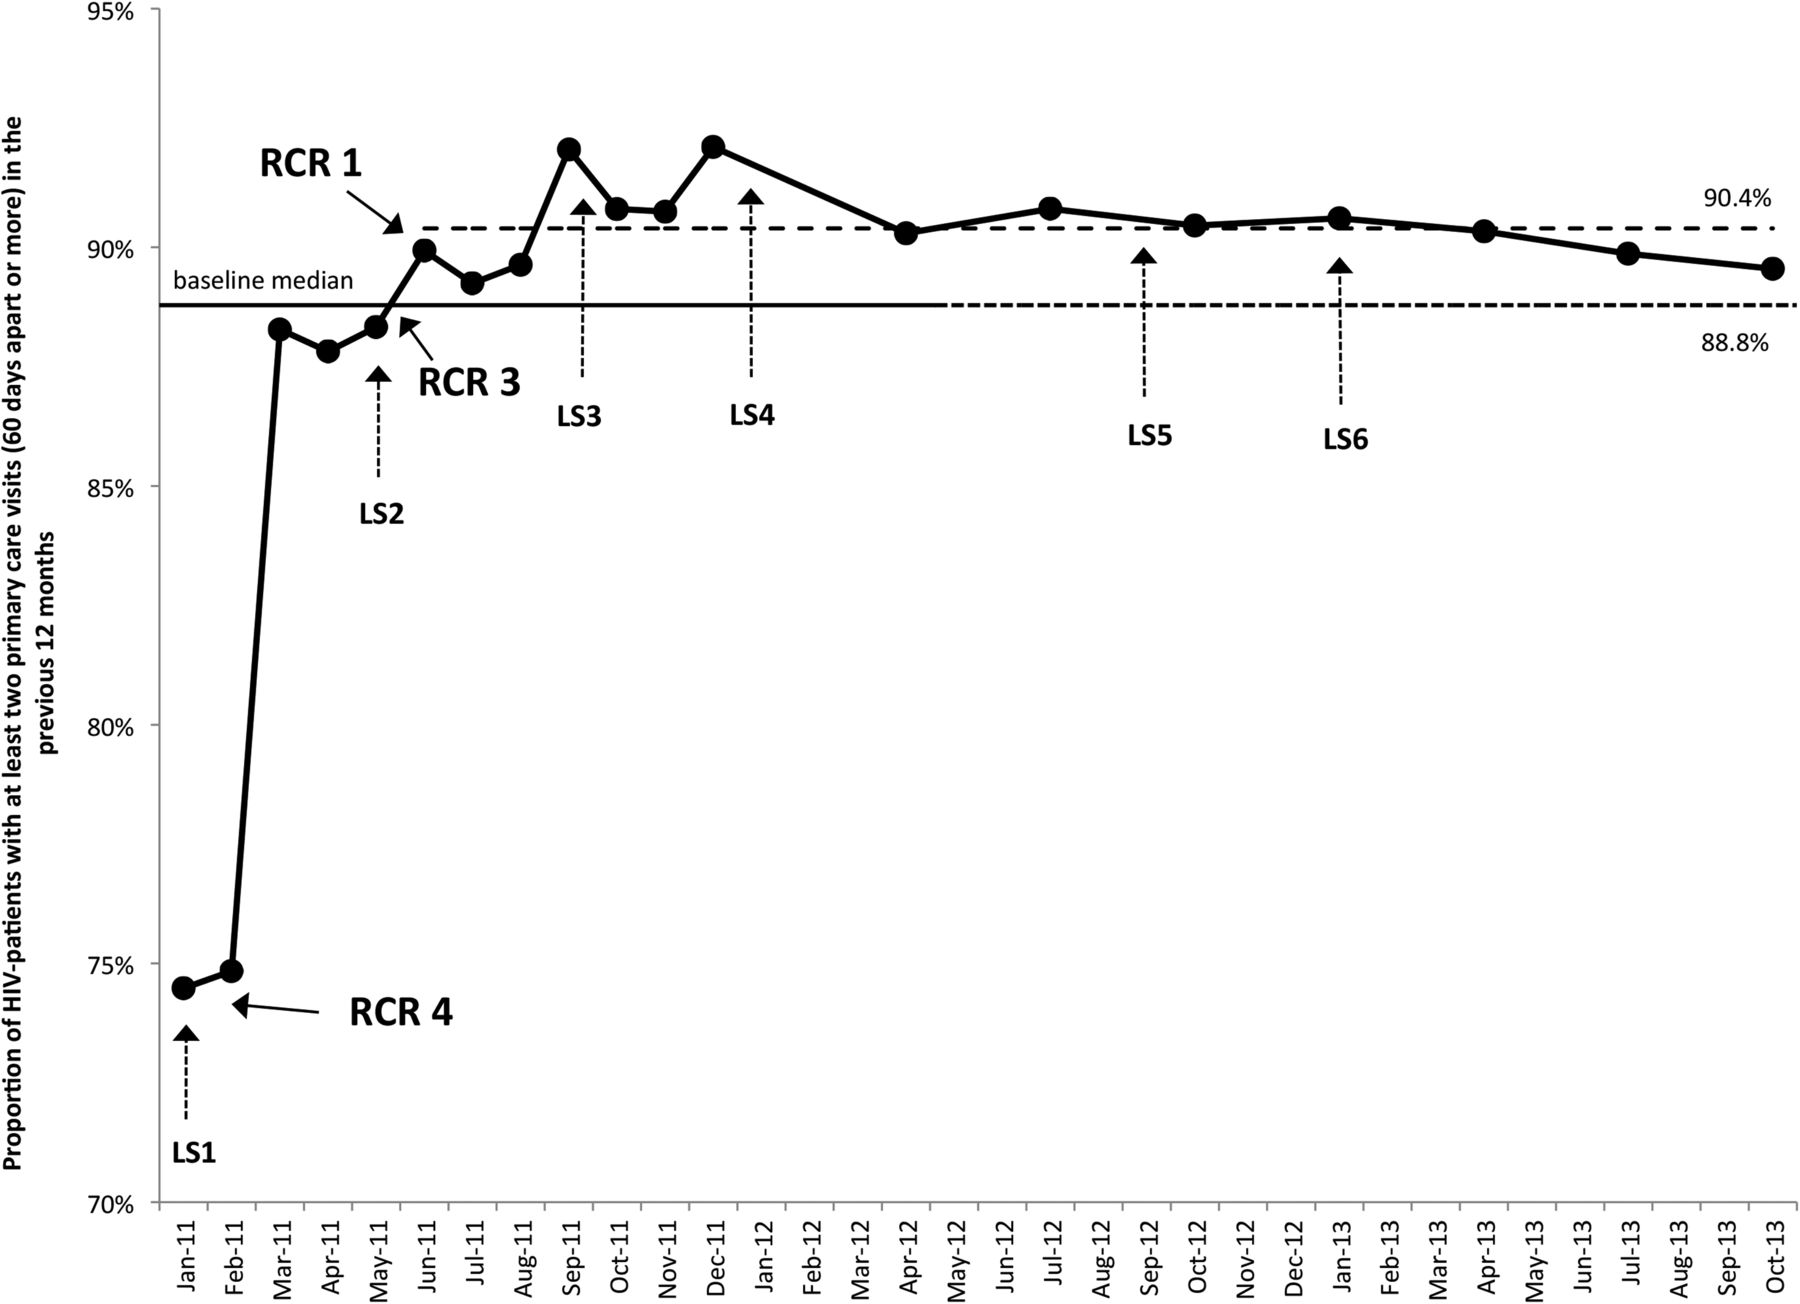
The baseline median proportion of HIV patients engaged in care was determined to be 88.8% (figure 3). Inspection of the run chart indicates a possible astronomical point (RCR 4) in January and February 2011. A shift above the baseline median (RCR 1) begins in June 2011 and there are too few runs (RCR 3, based on a lower limit of six runs for 19 data points not falling on the median), indicating evidence of improvement.34 A new median of 90.4% was calculated from June 2011 to October 2013.

Engaged in care. LS, learning session; RCR, run chart rule.
pVL testing every four months
The baseline median proportion of HIV patients with a pVL test in the previous four-month test was determined to be 84.9% (data not shown). A signal indicating a change was not detected.
ART uptake among those unequivocally in need
The median population of HIV patients with a known lifetime CD4 cell count <200 copies/mL was 919 out of a median of 2296 patients. Within this population, the baseline median proportion on ART was found to be 92.9% (figure 4). A shift above baseline median (RCR 1) begins in June 2011 and there are too few runs (RCR 3, based on a lower limit of six runs for 19 data points not falling on the median), indicating evidence of improvement.34 A new median at 94.8% was calculated from July 2011 to October 2013.
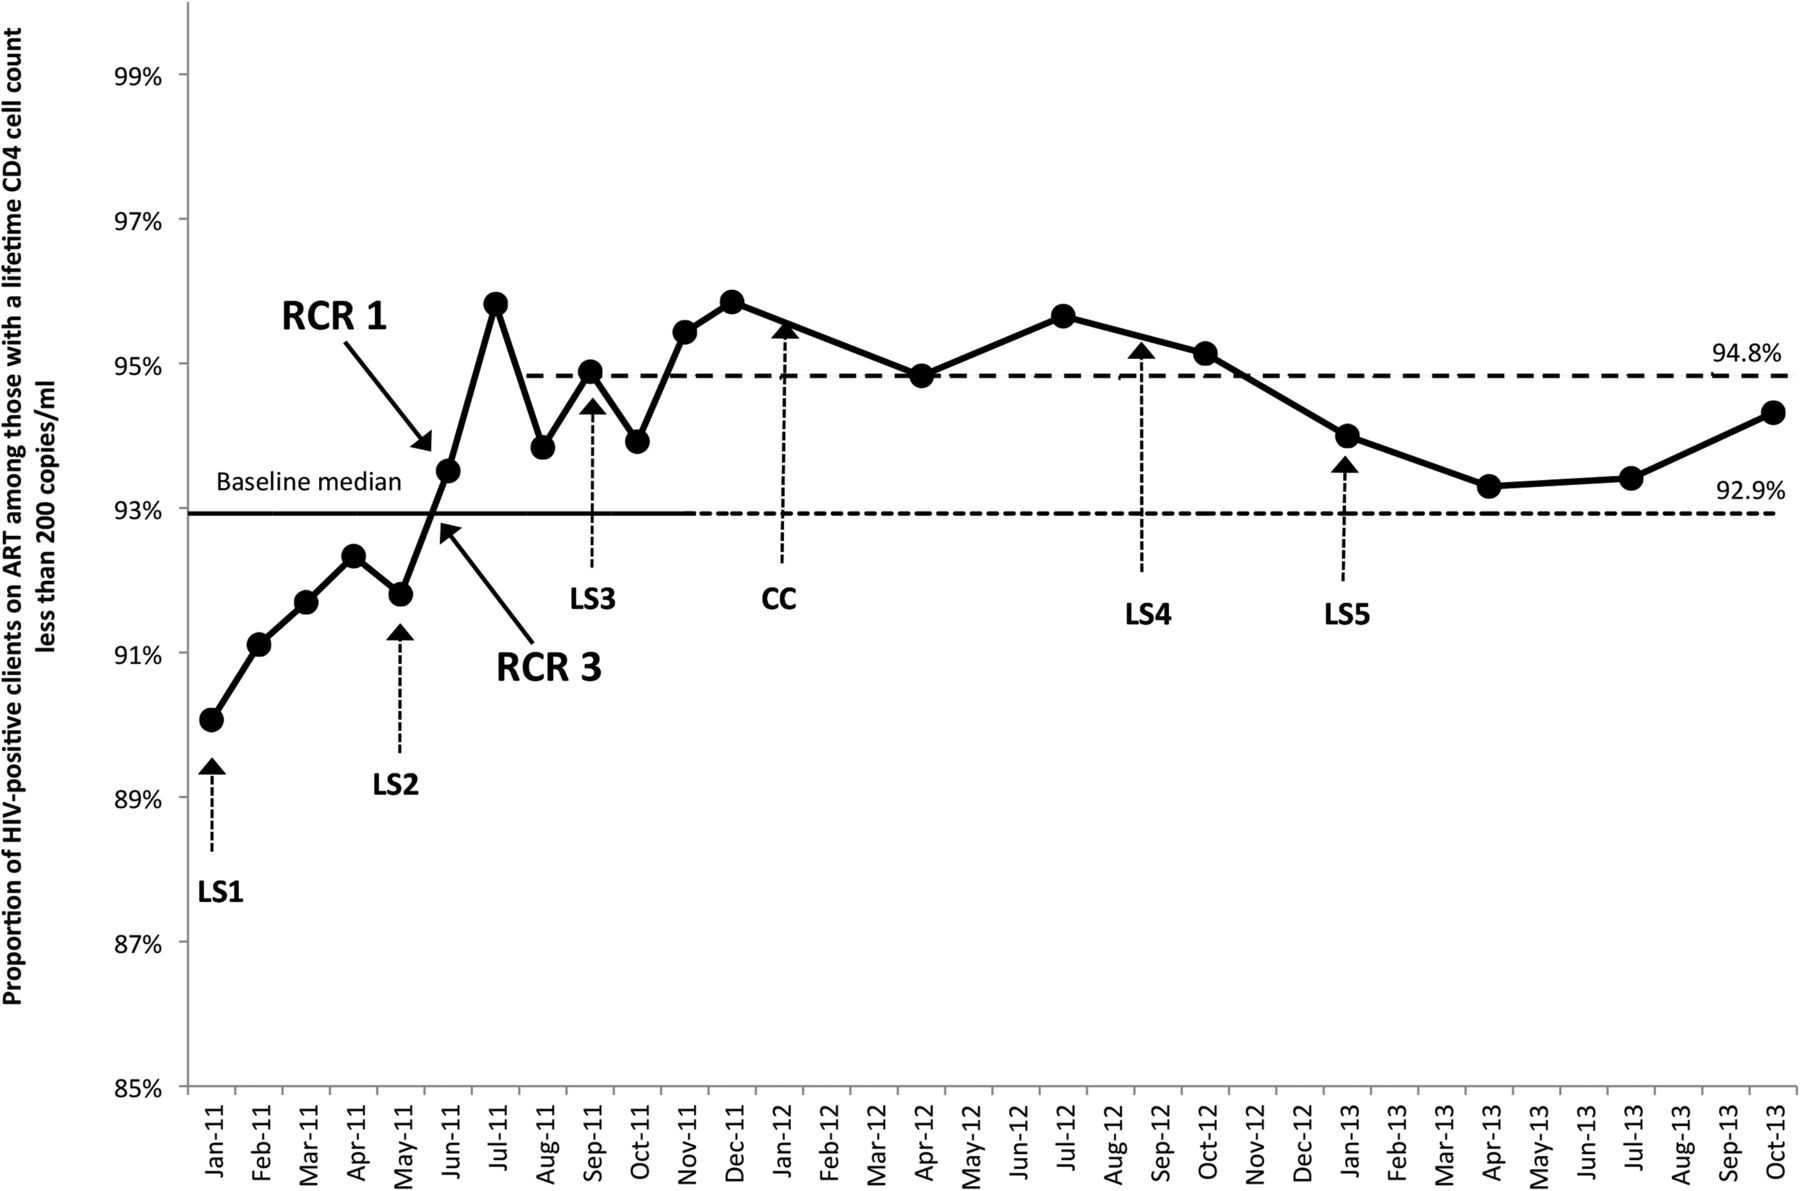
Antiretroviral therapy (ART) uptake among those unequivocally in need. LS, learning session; RCR, run chart rule.
ART uptake for ≥six months and achieving viral suppression
The baseline median proportion of HIV-positive clients on ART for ≥6 months and achieving viral suppression was determined to be 57.3% (figure 5). A shift above baseline median (RCR 1) begins in September 2011. Based on a lower limit of five runs for 17 data points not falling on the median, too few runs are observed (RCR 3) and a trend (RCR 2) begins in January 2012, indicating evidence of improvement.34 A new baseline median was constructed with data from April 2012 to October 2013 at 78.4%.

Antiretroviral therapy (ART) uptake for ≥6 months and achieving viral suppression. LS, learning session; RCR, run chart rule.
Discussion
Our results demonstrate sustained improvements in HIV care processes and treatment outcomes for a median population of 2296 HIV patients cared for by 17 teams that participated in a 35-month, multisite QIC and sustainability network in BC.
Modest but sustained evidence of improvement was observed for process indicators patient engagement in care and ART uptake among those unequivocally in need (figures 3 and 4). A more substantial, latent improvement was also observed for the outcome indicator proportion of patients on ART for ≥6 months and achieving viral suppression (figure 5). Interestingly, the finding that improvement was visible in process indicators before appearing in outcomes may strengthen the evidence in support of improvement. Taken together, these results are important as there is strong evidence indicating engagement in care, treatment uptake and viral suppression are associated with cost savings,3 ,25 fewer new HIV infections1 ,2 ,9 and significant reductions in HIV-related morbidity and mortality.1 ,3 ,4
Two possible astronomical points observed in January and February 2011 (figure 2) appear to show a considerable increase in the proportion engaged in care; however, this observation is theorised to point to better information systems rather than an actual increase in patient engagement. This is because teams initiated quality indicator collection with a review of HIV patient records. Teams sought to confirm the registration status of patients overdue for care, and in some cases, patients were eventually removed from lists with documentation of a move, transfer in care or death. Therefore, while this increase is unlikely to represent an improvement in patient engagement, it may signify better practices for summarising, reviewing and responding to accurate patient data. This is a foundational element of the CCM, enabling teams to enact a more organised, proactive response consistent with the needs of patients.36
While no improvement was observed for pVL testing frequency, a provincial HIV primary care guideline update in March 2011 reduced testing frequency to 6-month intervals for stable patients.37 Given the importance of regular clinical monitoring for managing viral suppression,1 QIC organisers preserved the indicator definition and suggested teams determine an appropriate target for their respective populations. Interestingly, the use of this indicator surfaced a number of structural barriers created by local transportation regulations and laboratory processing policies that were brought to the attention of health leaders and policymakers. Although evidence of improvement is not present in this indicator, it is not clear whether stable patients contributed to its stasis. Nevertheless, increasing awareness of system-level barriers has been cited as another important outcome of a QIC.15
While Breakthrough QICs are intended to be short-term initiatives—generally in the range of 12–18 months—our results indicate a period of time longer than the suggested QIC timeframe may be required to observe evidence of change in outcomes and sustainability.29 To illustrate, evidence of observable improvement in process and outcome indicators occurred 6 and 9 months after the first learning session, respectively. Notably, a trend in the outcome indicator was observed only after the QIC ended in January 2012. As such, this improvement might not have been detected if collection had not continued. While literature points to gaps in evidence supporting the sustainability of QIC outcomes, our results indicate sustained outcomes and also suggest that at least 12–24 months may be required to observe improvement and sustainability. For this, the adapted sustainability network model described herein may be of use to QIC organisers.
Delays in observable improvement also highlight the utility of implementation scores for understanding and managing interim QIC progress. These scores were found to be effective for communicating team progress with leadership and for providing concrete directions for teams to advance. Yet, while many studies provide general results of QIC interventions, few describe using an assessment or implementation score.15 ,38–40 Our results show that process and outcome indicator improvements coincided with a median cohort implementation score of 2.6 (changes tested) and 3.1 (modest improvement), respectively. We believe these markers may be useful to other QIC organisers seeking to manage and predict improvement.
Implementation scores also have promise for adding much needed characterisation of team progress and contribution to collective QIC outcomes. It is well understood that context plays an important role in any quality improvement intervention41 ,42 and a number of reviews call for studies to investigate and disentangle the interaction effects of context and QIC components.12–14 Of course, the difficulty and impracticalities of doing so are also widely acknowledged.12–14 Our results show that while every team made progress aligned with QIC shared aims, teams progressed variably in CCM implementation and quality indicator goal attainment. At a minimum, sites were successful in team formation and preliminary project planning inclusive of isolating a population of focus and defining an aim. The majority of teams progressed to partial CCM implementation and observable indicator improvement, while the remaining 29% of teams implemented a change in every CCM component, observed improvements for quality indicators and documented plans for spreading improvements. We believe more investigation into these scores, including linkage to improvement data and validation as markers for improvement, will be useful to understand and predict team success, and to help planners and leaders direct appropriate and timely supports throughout an improvement intervention.
Limitations to this study included the absence of a control group, possible selection bias (teams selected based on ability to participate) and possible bias and error in data (data obtained from team self-report for the purposes of improvement,43 and variable monthly team reporting rates, particularly for indicator 4). Our study would also have benefited from an analysis of the relationship between implementation scores and indicator outcomes. This is an important knowledge gap, pointing to future directions for investigation. It is also important to note that indicator 3 was defined before BC guidelines changed in March 2011, which transitioned recommended treatment initiation from a CD4 cell count <200 copies/mL to <350 copies/mL. Notably, this indicator would not have captured those with a CD4 cell count >200 copies/mL who may have been more likely to start treatment over the course of the QIC.
In spite of these limitations, we feel that the combined results of quality indicators and the implementation score outcomes build the case that this QIC was effective at improving HIV care and treatment outcomes. Indeed, these and other improvements will be required to reach global targets to eliminate new HIV infections and AIDS-related deaths.5 ,9
Conclusions
This study shows evidence of improved HIV care processes and treatment outcomes after a 35-month, multisite, QIC and sustainability network in BC, Canada. The overall success of this initiative points to opportunities for other high-income countries to close gaps in HIV care processes and treatment outcomes with quality improvement interventions to scale up access to ART and improve health system organisation. Results also point to the utility of implementation scores or collaborative assessment scales for managing team progress in a QIC. Greater use and further analysis of these scores may support a more contextualised approach to managing the progress of individual teams in large-scale improvement efforts and help to clarify the characteristics of successful teams. Finally, these results also demonstrate that at least 12–24 months after a QIC intervention may be required to observe latent improvements, particularly for outcome indicators, and sustainability of outcomes.
Acknowledgments
We wish to acknowledge support and guidance from Dr. Julio Montaner, Irene Day, as well as past and present planning group members including Bethina Abrahams, Misty Bath, Dr. David Hall, Judy Huska, Janice Jespersen, Elena Kanigan, Paul Kerston, Dr. Ashnoor Nagji, Jonathan Postnikoff, Ana Prado, Junine Toy, Dr. David Tu, and Romari Undi. We also wish to acknowledge support from the Government of British Columbia and all participant organizations including the First Nation Health Authority, Fraser Health, Interior Health, Northern Health, Positive Living BC, Providence Health Care, Provincial Health Services Authority, Vancouver Coastal Health, and Island Health.
References
Supplementary materials
Supplementary Data
This web only file has been produced by the BMJ Publishing Group from an electronic file supplied by the author(s) and has not been edited for content.
- Data supplement 1 - Online supplement
Footnotes
Twitter Follow Christina Clarke at @_ChristinaClar
Competing interests RB has received speaking fees from Gillead
Ethics approval According to the relevant University of British Columbia policy, this study met the criteria for improvement purposes exempt from ethics review.
Provenance and peer review Not commissioned; externally peer reviewed.
Data sharing statement We have additional data from this intervention that we are currently preparing for publication in another manuscript, any parties interested in viewing this data may contact the corresponding author.