Article Text

Abstract
Aim From the most recent data the magnitude of visual impairment and its causes in 2010 have been estimated, globally and by WHO region. The definitions of visual impairment are the current definitions of presenting vision in the International Classification of Diseases version 10.
Methods A systematic review was conducted of published and unpublished surveys from 2000 to the present. For countries without data on visual impairment, estimates were based on newly developed imputation methods that took into account country economic status as proxy.
Results Surveys from 39 countries satisfied the inclusion criteria for this study. Globally, the number of people of all ages visually impaired is estimated to be 285 million, of whom 39 million are blind, with uncertainties of 10–20%. People 50 years and older represent 65% and 82% of visually impaired and blind, respectively. The major causes of visual impairment are uncorrected refractive errors (43%) followed by cataract (33%); the first cause of blindness is cataract (51%).
Conclusion This study indicates that visual impairment in 2010 is a major health issue that is unequally distributed among the WHO regions; the preventable causes are as high as 80% of the total global burden.
- Blindness
- causes
- drugs
- epidemiology
- low vision
- pathology
- prevalence
- public health
- visual impairment
- vision
Statistics from Altmetric.com
In order to set policies and priorities and to evaluate global eye health, it is essential to have up to date information on prevalence and on causes of visual impairment. As it previously did in 1995, 2002 and 20041–3 the WHO Prevention of Blindness and Deafness Programme has carried out a systematic search and review of all available data to obtain a global estimate of visual impairment for 2010. Estimates of visual impairment have been derived at a global level and in the six WHO regions. The major causes of visual impairment and of blindness have been determined. These estimates provide essential information for the prevention of visual impairment and the improvement of eye health globally.
Methods
Definitions
The definitions of visual impairment used for the estimates in this study follow the categories of the International Classification of Diseases Update and Revision 2006 that defines impairment according to presenting vision.4
Visual impairment comprises categories 1 to 5, blindness, categories 3 to 5. The two categories of moderate and severe visual impairment (<6/18≥6/60 and <6/60≥3/60) are combined in this study (<6/18≥3/60) and they are referred to as ‘low vision’.
Population estimates and WHO regions
Population size and structure are based on the current population tabulation of WHO according to ‘World Population Prospects: the 2008 Revision’, from the United Nations Population Division.5
The estimates are reported for the six WHO regions.6
Socioeconomic data
Sources of the indicators used are the Human Development Report 2009 from the United Nations development programme,7 the World Bank development indicators 2009,8 the Organization for Economic Co-operation and Development policy briefs 2009,9 data from the United Nations economic and social commission for Asia and the Pacific,10 the World Health statistics 200911 and governmental statistical data.
Sources of epidemiological data and inclusion criteria
Inclusion criteria have been discussed previously:2 3 12 the studies have to be population based, representative of the country and of the area sampled, with sample size adequate to the population sampled (from 1200 to 46 000), sufficient response rate (80% or higher), reporting data for persons, with definitions of visual impairment in agreement with those used in this study.
Medline was searched for published data with no language restriction (search terms: Visual Impairment, Blindness, Prevalence, country and continent names; last search on 30th June 2010); studies were searched in the WHO regional databases;13 unpublished data available to WHO/Prevention of Blindness and Deafness were also used if satisfying the inclusion criteria.
Estimates of prevalence
The prevalence of visual impairment and blindness were determined for the six WHO regions for three age groups: 0–14 years, 15–49 years and 50 years and older, non-disaggregated by gender. These age groups are consistent with the available data sources and with the grouping used in WHO for similar estimates of prevalence. Smaller age groups were not considered because data given in the studies are adjusted by sample composition only for larger age groups, and smaller age groups would have much higher uncertainties. Gender stratification was not attempted given the inconsistencies of the data within regions and countries, the uncertainties in the gender stratification could lead to even higher uncertainties at a global level.
Estimates of prevalence for the age groups 0–14 and 15–49 years were calculated applying to the actual population size and structure the prevalence from the most recent estimates by WHO2 3 that were considered still valid. The regional prevalence was obtained from population-based studies from countries with data and imputed estimates for countries missing data. The imputation process was based on a model that utilised three parameters, gross domestic product per capita in 2007 measured in purchasing power parity (PPP),8 World Bank classification of economies (low income, lower middle income, upper middle income, high income)8 and the prevalence of blindness in the age group 50 years and older, chosen because of the many studies available, a consequence of the prevailing use of rapid assessment survey protocols focused on this age group. As the prevalence of blindness and visual impairment were strongly correlated with each other, only the prevalence of blindness was selected as the parameter. The correlation between PPP and the prevalence of blindness was consistently strong in all regions, with coefficients greater than 0.8, other socioeconomic7 9 10 or health indicators11 were tested and showed only weak correlations (0.5 or less). In each WHO region the countries were clustered into ranges of PPP and World Bank classification of economies.8 A weighted prevalence of visual impairment and blindness was calculated for countries with data within a PPP cluster and imputed to the other countries in the same cluster. A discussion of methods for missing data can be found in International Labour Organization Employment Trends Units.14
Estimates of causes of visual impairment
For the age groups 0–14 and 15–49 years the causes of visual impairment are based on previous estimates.2 3 For the age group 50 years and older the causes were calculated using the causal attribution provided by the studies that were used to estimated the prevalence. Each cause was calculated as an average percentage of the total causes at regional level first and then at global level, by including all the regional values.
Error analysis
As only simple imputation using deductive methods was used and no regression analysis was conducted, the known errors on the regional estimates come from the reported uncertainties of the studies, which for the age group 50 years and older are approximately 10%, for the other ages approximately 20%.
Additional uncertainties are due to data imputation; these can be assumed to be lower in regions with more numerous studies.
Results
Data sources
Fifty-three surveys from the 39 countries, listed in table 1, met the inclusion criteria for this study: details are found in annexes 1 and 2, available online only. The majority of the studies, 38, took place between 2005 and 2008, 15 between 2001 and 2004; the largest majority were rapid assessments of cataract surgical services or of avoidable blindness,15 16 a minority were national studies for all ages, some were targeting specific age groups or settings. Other studies not fully satisfying the inclusion criteria provided supporting evidence for the estimates developed by the model.
Studies used for the global estimate of visual impairment, 2010
Model of visual impairment in the six WHO regions
Visual impairment was estimated in each WHO region with a model built using the prevalence of blindness and countries' economic status from available data as described in the Methods section.
The African region comprises 46 countries of which 40 are classified by the World Bank either as low income (LI) or lower middle income (LMI) within a narrow range of PPP, representing 93.2% of the population in the region. Five countries are classified as upper middle income (UMI) and one as high income (HI), representing 6.8% of the region population. Nineteen surveys from 12 countries, all classified as LI or LMI, were available for inclusion in the model for the region. Given the similar economic status of these countries they were considered as a single cluster of PPP. The weighted prevalence of visual impairment and blindness from the 19 surveys was imputed to the whole region.
In the region of the Americas the 36 countries were divided into three clusters of PPP corresponding to the World Bank classifications: LMI (10 countries), UMI (20 countries), HI (six countries). Data were available from three countries in the LMI cluster, and seven in the UMI cluster. The combined population in the 10 countries with available data in the LMI and UMI clusters represented 80% of the total population in these 30 countries. The weighted average of the prevalence of visual impairment and blindness was derived separately in the two clusters and imputed to the other countries in the same cluster. Recent data satisfying the inclusion criteria for this study for the HI cluster were not available; prevalence was derived from previous WHO estimates.2 3
The 21 countries in the eastern Mediterranean region were sorted into two clusters of PPP. The first included 13 countries classified as LI and LMI, the second eight countries classified as UMI and HI. Data from three countries in the LI/LMI cluster and from one in the UMI/HI cluster were available for estimates.
In the European region three economic clusters were defined, one including 25 HI countries, a second 11 UMI countries, and the third 14 LMI and three LI countries. Data were available from one country each in the UMI and in the LMI/LI clusters. The data from a single country were imputed to the UMI cluster and analogously data from a single country to the LMI/LI cluster. Recent data for this study were not available for the HI cluster and previous WHO estimates were used.2 3
The estimates for the south-east Asian region were derived for India and for the other countries in the region separately. The prevalence for India was derived from three recent surveys (see annexes 1 and 2, available online only). The other 10 countries in the region are classified either as LMI or LI, and given the similarity of PPP were all included in one single cluster. Data were available from five of the 10 countries comprising almost 80% of the population in the region (India excluded). The weighted prevalence estimated from the data in the five countries was imputed to the whole cluster.
The estimates for China were derived separately from the other countries in the western Pacific region, and were based on recent surveys conducted in the rural areas combined with data from urban settings (see annexes 1 and 2, available online only). The other countries in the region were sorted into three clusters: the first included seven countries classified as HI and one as UMI; the second included all 15 Pacific Islands with 14 countries classified as LMI and one UMI; the third comprised four countries, two classified as LI and two as LMI. For the first cluster prevalence was derived from the previous estimates.2 3 Data from one country were used for the second cluster and data from three countries for the third cluster (see annexes 1 and 2, available online only).
Global prevalence of visual impairment
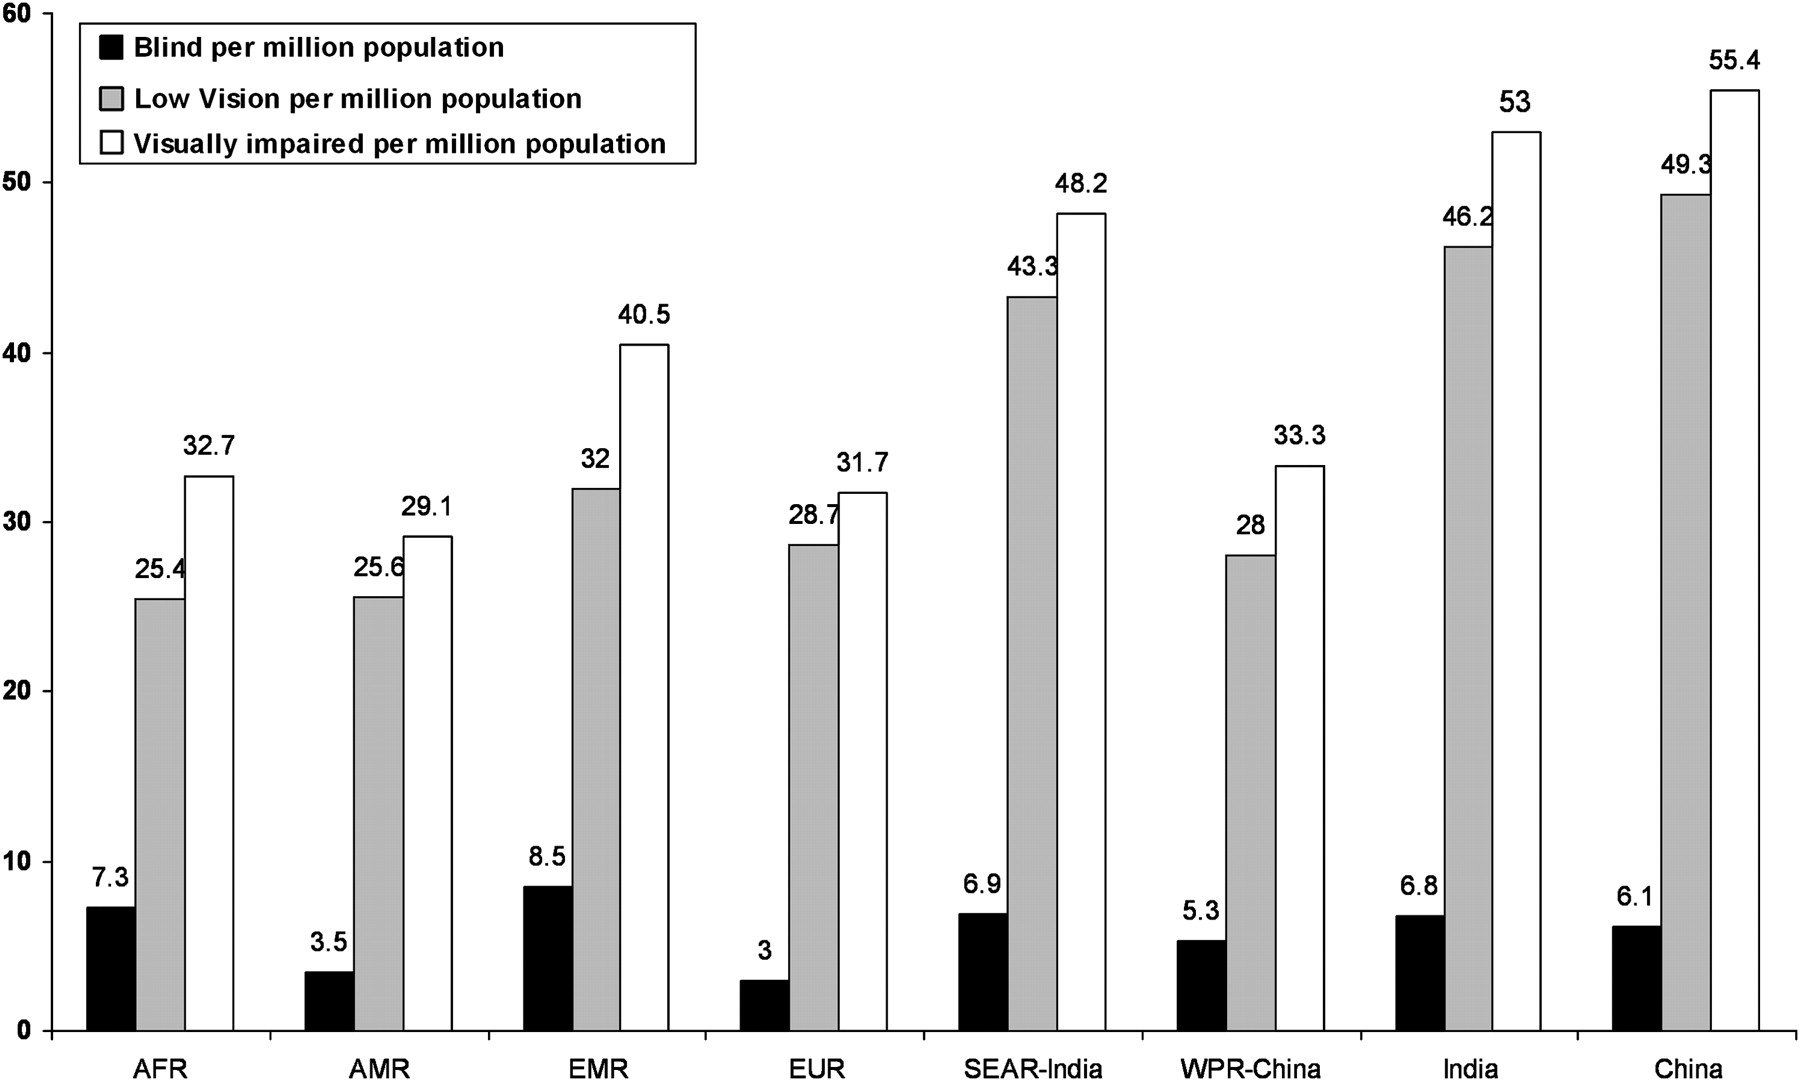
The estimated number of people visually impaired in the world is 285 million, 39 million blind and 246 million having low vision; 65% of people visually impaired and 82% of all blind are 50 years and older (table 2). The distribution of people visually impaired in the six WHO regions is shown in table 3 with the percentage of the global impairment shown in parentheses. Figure 1 shows the number of people visually impaired, with low vision and blind per million population in the six WHO regions and in India and China separately.
Global estimate of the number of people visually impaired by age, 2010; for all ages in parenthesis the corresponding prevalence (%)
Number of people visually impaired and corresponding percentage of the global impairment by WHO region and country, 2010

Number of people (in 1000s) blind, with low vision and visually impaired per million population by WHO region and country, 2010. AFR, African region; AMR, region of the Americas; EMR, eastern Mediterranean region; EUR, European region; SEAR, south-east Asian region (without India); WPR, western Pacific region (without China).
Cause of visual impairment
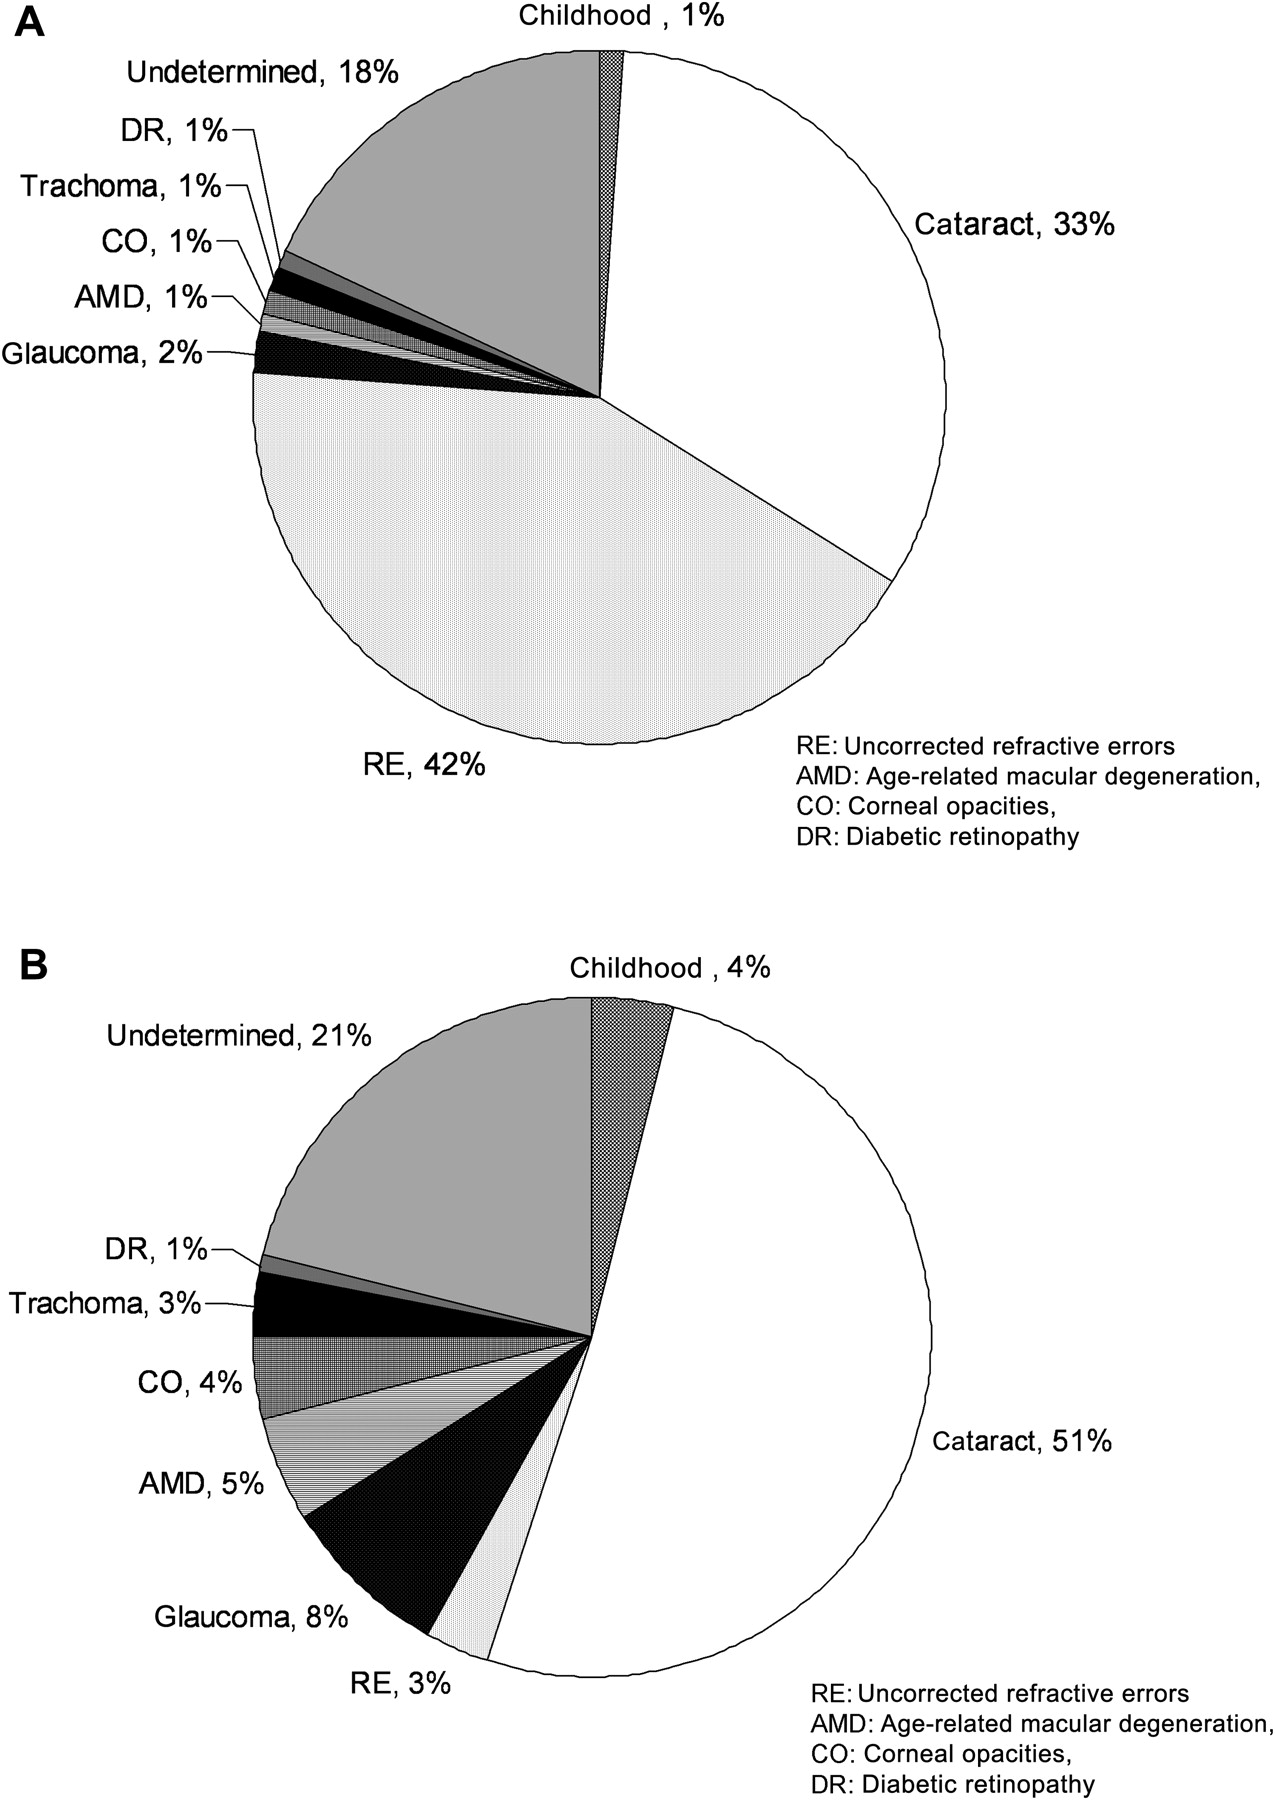
Globally, the principal causes of visual impairment are uncorrected refractive errors and cataracts, 43% and 33%, respectively. Other causes are glaucoma, 2%, age-related macular degeneration, diabetic retinopathy, trachoma and corneal opacities, all approximately 1%. A large proportion of causes, 18%, are undetermined (figure 2A). The causes of blindness are cataract 51%, glaucoma 8%, age-related macular degeneration 5%, childhood blindness and corneal opacities 4%, uncorrected refractive errors and trachoma 3%, and diabetic retinopathy 1%, the undetermined causes are 21% (figure 2B).
(A) Global causes of visual impairment, inclusive of blindness, as percentage of global visual impairment in 2010. (B) Global causes of blindness as percentage of global blindness in 2010. AMD, age-related macular degeneration; CO, corneal opacities; DR, diabetic retinopathy; RE, uncorrected refractive errors.
Discussion
This study presents some limitations, the most significant are the following: the surveys in the past 10 years have been mostly rapid assessments for ages 50 years and older, and national studies for all ages with or without WHO eye survey protocol have been few. As a consequence data could be limited in the representation of countries and of ages. The imputation of prevalence for missing data can give errors that are difficult to estimate; clearly they could be high in regions with sparse data. In the eastern Mediterranean region recent data were unavailable for most of the countries, therefore the estimates were in large extent based on surveys from 1993 to 1998.2 3 Data from HI countries were also missing or were dated as far back as 15 years. However, it must be noted that in HI countries from available information there was no evidence of major changes in prevalence.
The combined effect of these uncertainties is possibly an over or underestimation of visual impairment and blindness of approximately 20%.
The attribution of the causes of visual impairment and blindness is also prone to uncertainty. This is often the case in surveys carried out in the field with limited diagnostic capacity, but it is particularly true in the case of rapid assessments whose aim is primarily to survey cataract surgical services for ages 40 or 50 years and older. The large percentages of undetermined causes are also likely to be a reflection of these protocols.
The strengths of the estimates derive first from the fact that new data were available to replace previous extrapolations. Furthermore, to estimate the prevalence of visual impairment in countries missing data, a model was used based on the same economic parameters for all countries. This is a new approach in producing estimates of visual impairment. The imputation process via a model is more transparent than using expert assumptions and it provides consistency between countries and regions. It also allows for adjustments and corrections as soon as new information becomes available and it could also be adapted for estimating trends.
Because data available and methods used have changed, it is not possible to draw conclusions from differences in present estimates and previously published estimates. In areas where surveys were repeated with similar protocols for ages 50 years and older a reduction of visual impairment is shown despite the rapid growth of this age group. This decline fits with increased socioeconomic development, but it is also the direct consequence of investments made by governments and of interventions by international partners.
Posterior segment (retinal) diseases are a major cause of visual impairment worldwide, and are likely to become more and more important with the rapid growth of the ageing population. The proportion of the total visual impairment and blindness from age-related macular degeneration, glaucoma and diabetic retinopathy is currently greater than from infective causes such as trachoma and corneal opacities.
This requires the urgent development of eye care systems that address chronic eye diseases with rehabilitation, education and support services.
Conclusion
Monitoring the magnitude of visual impairment is essential for policies aiming at the prevention and elimination of the avoidable causes. The global estimates have significant uncertainties that could be reduced with population-based studies from regions with limited or old data and with studies conducted at the national level for all ages recording all causes of blindness. Particularly urgent is to determine the extent of posterior segment diseases as causes of visual impairment, because these require the development of eye care systems, including human resources and infrastructures.
Acknowledgments
The authors would like to thank Dr N Banatvala for insightful comments.
Supplementary materials
Supplementary Data
This web only file has been produced by the BMJ Publishing Group from an electronic file supplied by the author(s) and has not been edited for content.
Files in this Data Supplement:
- Download Supplementary Data (PDF) - Manuscript file of format pdf
- Download Supplementary Data (PDF) - Manuscript file of format pdf
Footnotes
Funding This work was partly supported by the International Agency for the Prevention of Blindness (DP) and by the Lions Clubs International Foundation (SPM).
Competing interests DP and SPM are staff members of the WHO. The authors alone are responsible for the views expressed in this publication, and they do not necessarily represent the decisions, policy or views of the WHO.
Provenance and peer review Not commissioned; externally peer reviewed.
Linked Articles
- At a glance