Assessing the Impact and Equity of an Integrated Rural Sanitation Approach: A Longitudinal Evaluation in 11 Sub-Saharan Africa and Asian Countries


Abstract
:1. Introduction
2. Materials and Methods
2.1. Study Context
2.2. SSH4A Approach
- (1)
- Demand creation focuses on the capacity of local organizations to implement and steer sanitation demand creation processes at scale with quality in their area. That starts with the capacity of the local government to organize demand creation, ensuring harmonization, quality standards and sufficient attention to potentially vulnerable and/or culturally different groups. The component also includes strengthening of individual capacities of facilitators or health promotors to implement demand creation methodologies (often community-led total sanitation, or CLTS) respectfully, planned and in an inclusive way. It emphasizes timely post-triggering and follow-up, as well as support to informed technology choices by households.
- (2)
- Sanitation supply chain and financing strengthening applies consumer studies, sanitation supply chain analysis, and business modelling to understand supply and demand of the sanitation market in each program area. Governments used this information to increase local capacity, improve financing mechanisms, support informed choice, and private sector to realize market-based solutions that meet changing consumer needs and preferences. Subsidies were not part of the SSH4A approach and emphasis was on the importance of local business development to ensure sustainability and community level support mechanisms. Some activities related to supply chain strengthening include hardware option analysis, development of informed choice materials for households (especially elderly and disabled), design of innovative latrine options, development of technology options handbooks, development of marketing materials, business development training for local businesses, masons communication training, review of affordability of latrines, and development of toilet upgrading strategies (e.g., adding a second pit or handwashing facility).
- (3)
- The hygiene behavioral change communication component aimed at strengthening the capacity and implementation of evidence-based behavioral change communication for relevant agencies (partner agencies for this component in each country, depended on which agencies had the mandate for hygiene behaviour change activities within the country) at the sub-national level. The component targeted key hygiene behaviors emerging from the survey data such as cleanliness of toilets, using soap while hand washing, disposal of child feces. The behavior change methodology begins with stock taking of existing behavioral change activities and reflection on results so far, together with the responsible agency. Then it defines priority behaviors and audiences on which formative research is conducted. Application of findings from formative research studies, alongside participatory review of existing information, leads to the development of a locally-specific behavior change strategy (typically district level BCC strategies linked to the district sanitation strategy) and buy-in. Other activities include design of behavioral change communication (BCC) campaigns and other materials (e.g., posters, videos, radio messages, personal communication, activities, theater), training of field staff specific to BCC work (once individuals or local unit is assigned as responsible for BCC activities), and regular review and updating of the strategy, messages, and materials as needed.
- (4)
- WASH Governance works to strengthen local authorities and support them to promote and achieve district-wide coverage. SNV engaged both locally (i.e., strengthening capacity for sustainable service delivery in local government, the private sector, and civil society) and at the sub-national level (i.e., working with the government, rights group holders and development partners to support sector reform). The WASH governance approach was based on the belief that national and local governments are the duty bearers for a progressive realization of sanitation as a human right in their countries and districts. Building capacity and leadership from the beginning with prioritized high-level governance was important to support the sustainability and scalability of WASH interventions. Some specific activities related to governance include regional workshops for decision makers and stakeholders, development of Open Defecation Free status (ODF) and post-ODF strategies and certification standards that all stakeholders agree with, dialogue with rights holder groups, development of pro-poor policies and mechanisms to support those in the lowest wealth quintile, targeted support for female-headed households, persons with disabilities, and the elderly included in these strategies, and ensuring that vulnerable individuals are included in dialogues and decision making.
2.3. Pre-study Context
2.4. Data Collection and Follow-Up
2.5. Outcome Variables
2.6. Equity Across Vulnerable Groups
2.7. Analysis
2.8. Synthesis of Results Across Countries
2.9. Equity Analyses
2.10. Multivariable Analyses
3. Results
3.1. Demographics
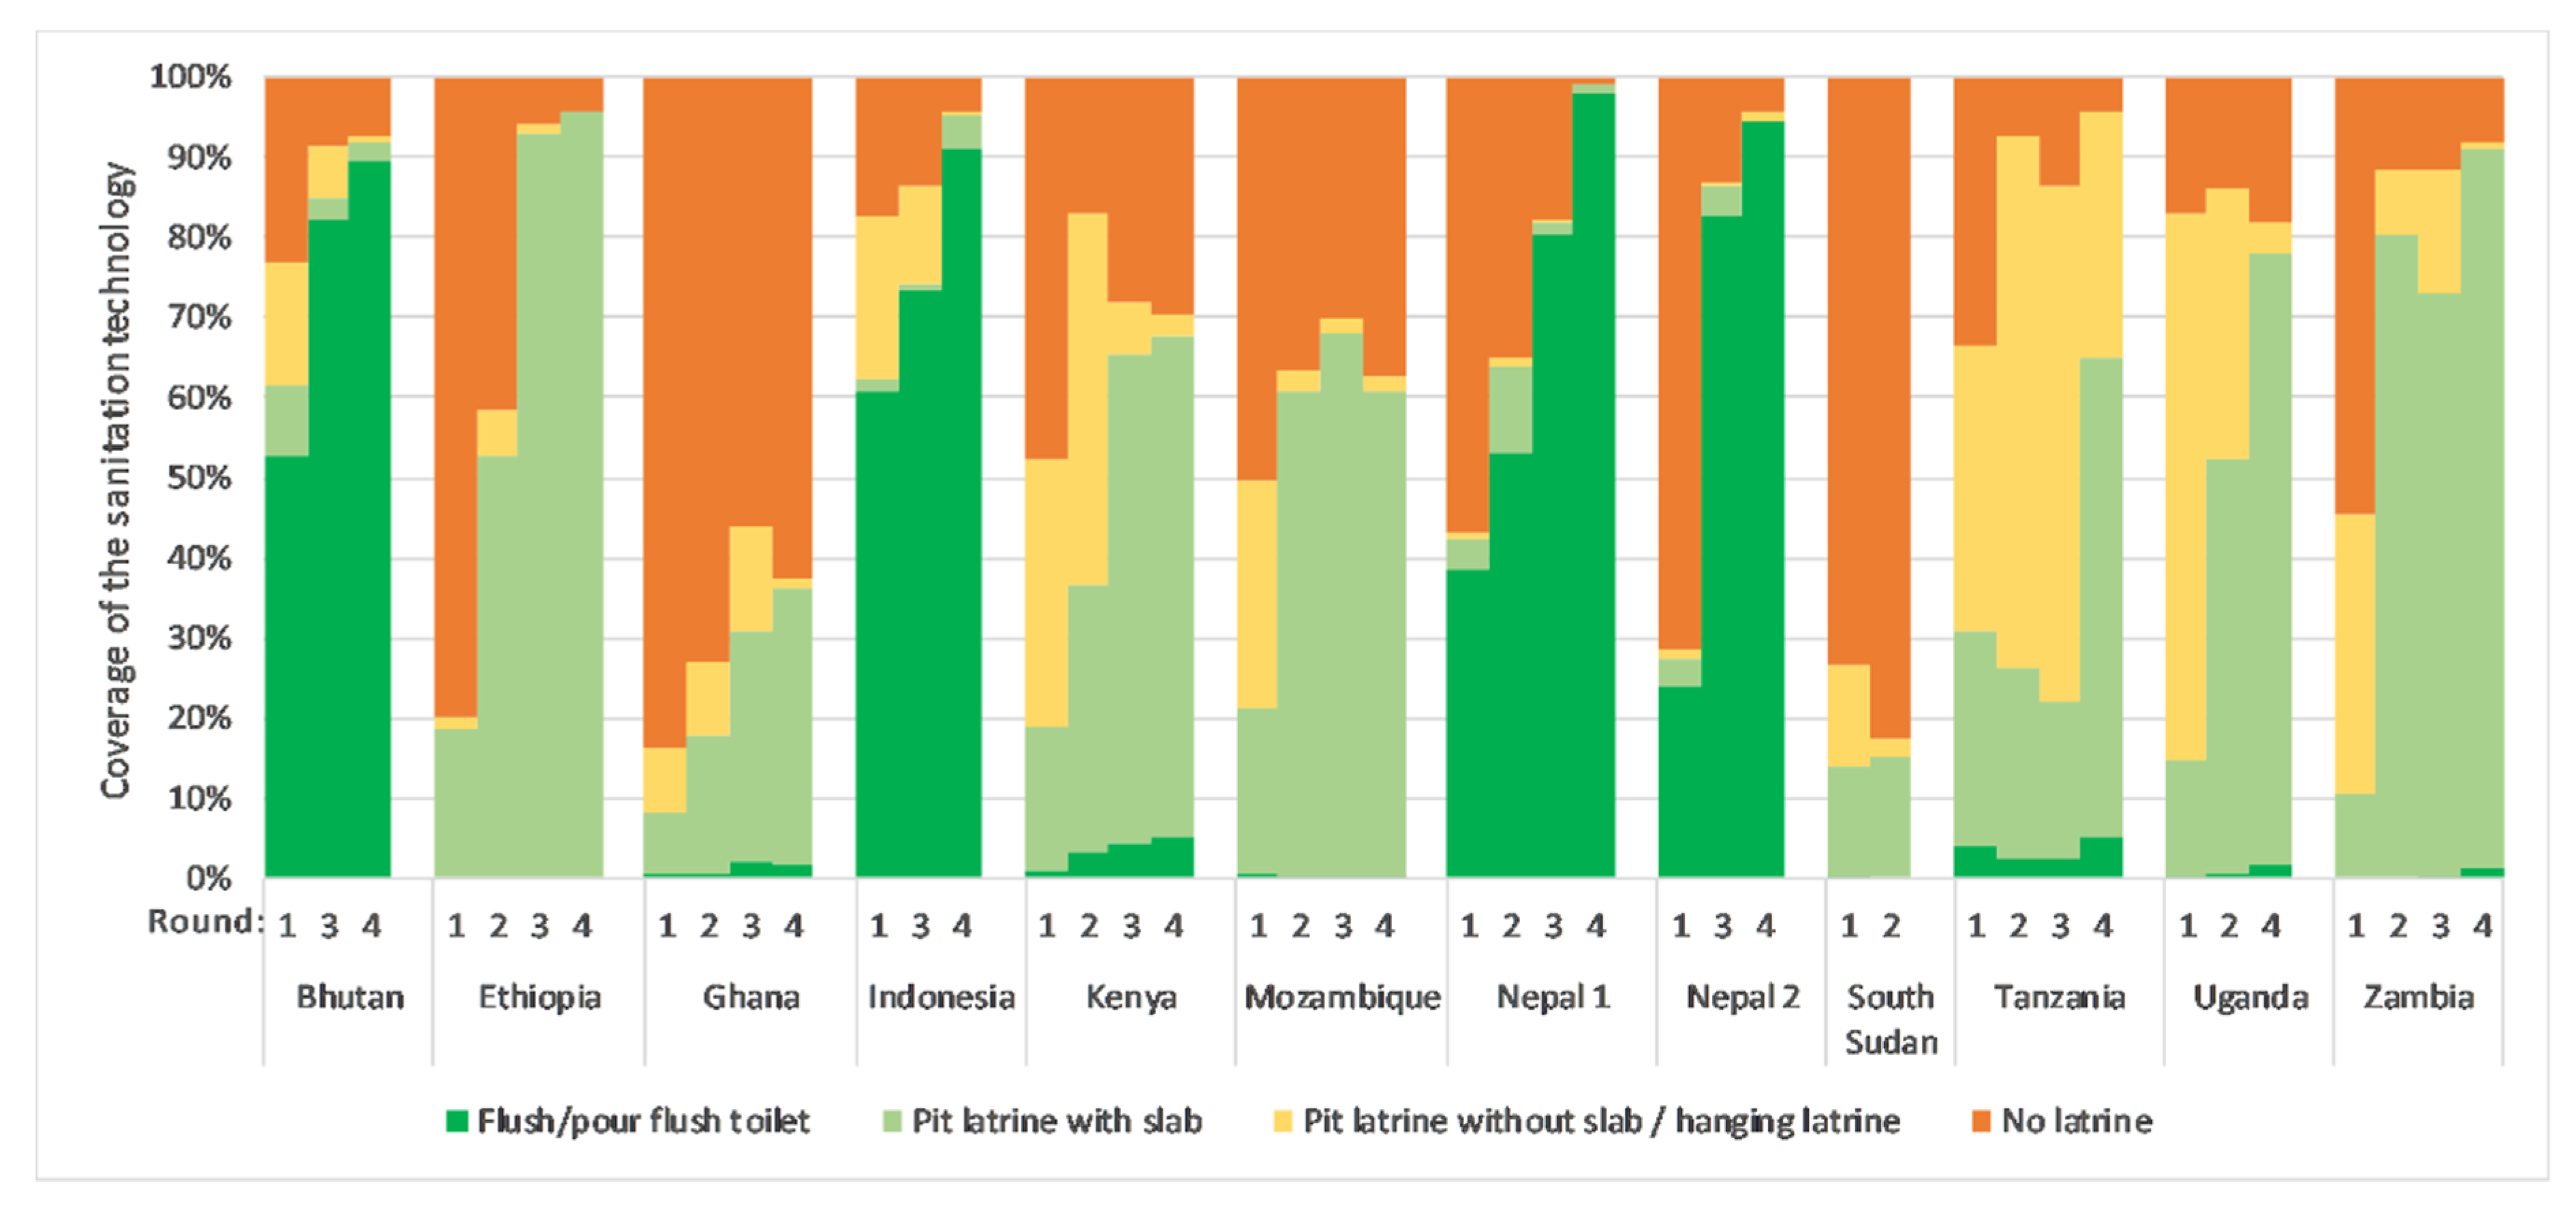
3.2. Sanitation
3.3. Disposal of Child Feces
3.4. Hygiene
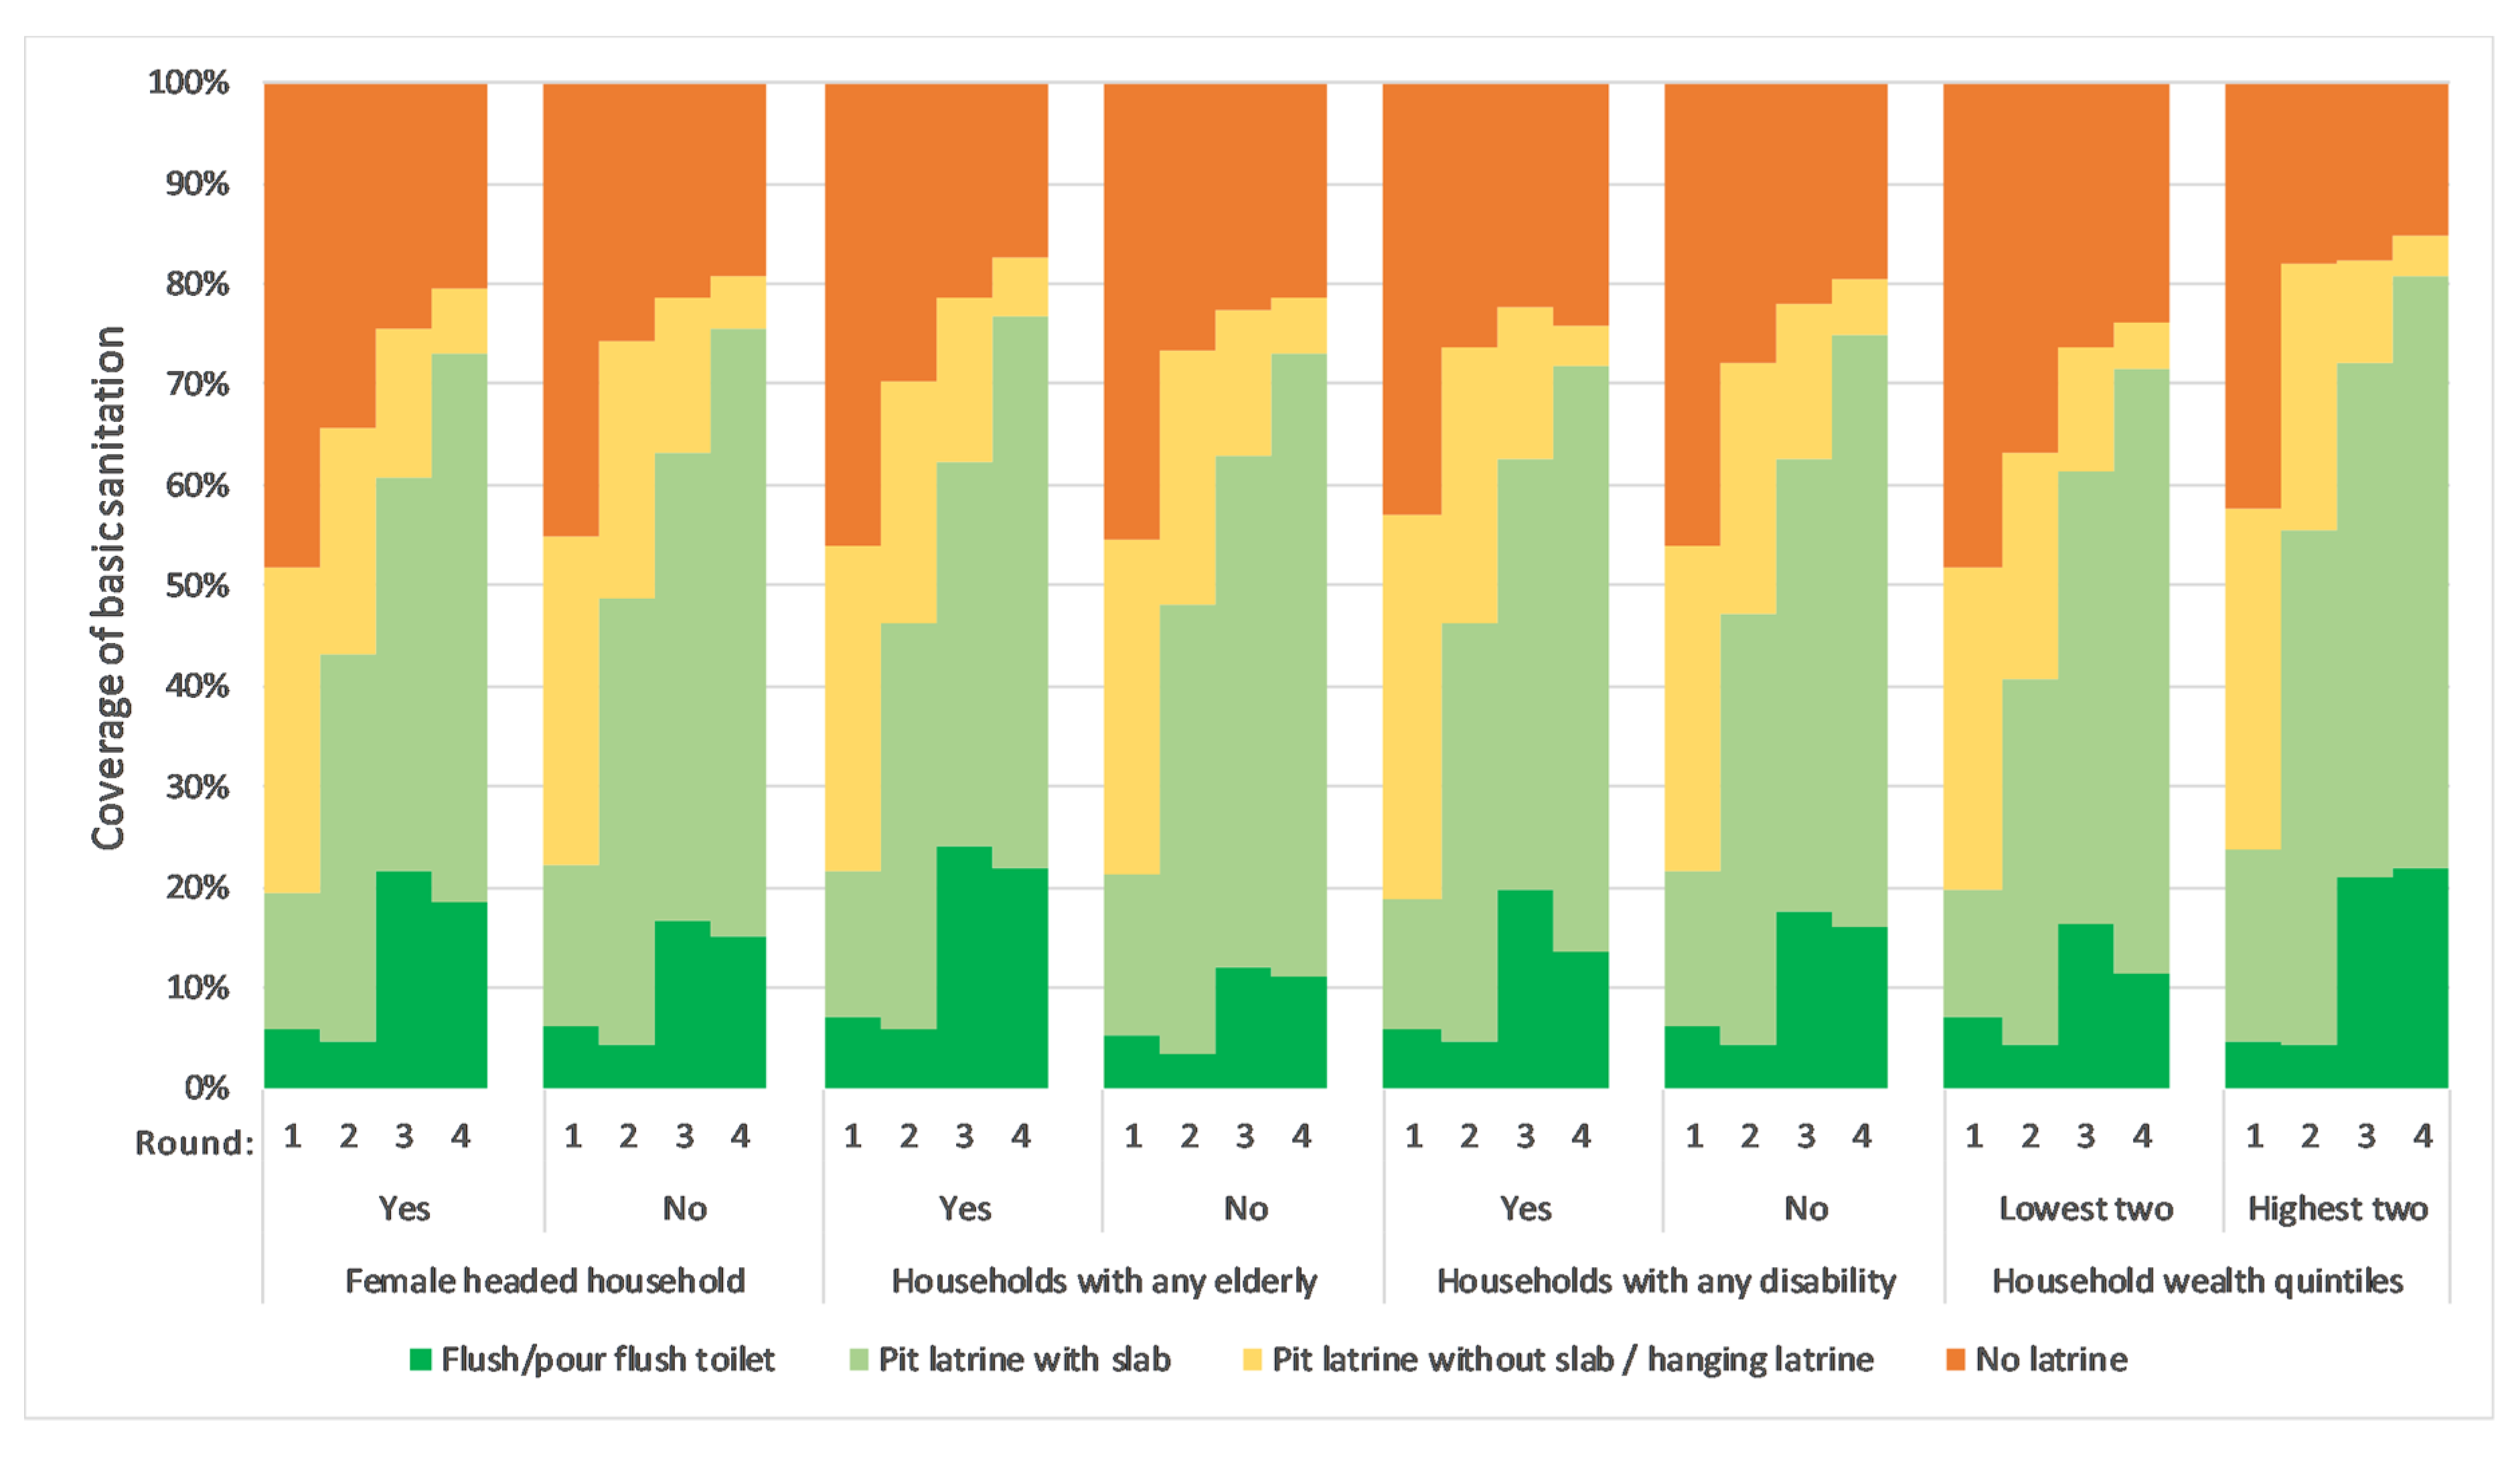
3.5. Equity of Basic Sanitation between Vulnerable and Non-Vulnerable Groups
4. Discussion
5. Conclusions
Author Contributions
Funding
Acknowledgments
Conflicts of Interest
Appendix A


| Program Area | R1 Prevalence (95% CI) | R2 Prevalence (95% CI) | R3 Prevalence (95% CI) | R4 Prevalence (95% CI) | R2 Difference (95% CI) | R3 Difference (95% CI) | R4 Difference (95% CI) |
|---|---|---|---|---|---|---|---|
| Bhutan | 62% (58%, 65%) | 72% (68%, 77%) | 85% (82%, 87%) | 92% (90%, 94%) | 11% (5%, 17%) | 23% (19%, 28%) | 30% (26%, 34%) |
| Ethiopia | 19% (17%, 20%) | 53% (51%, 55%) | 93% (92%, 94%) | 95% (95%, 96%) | 34% (31%, 37%) | 74% (72%, 76%) | 77% (75%, 79%) |
| Ghana | 8% (7%, 10%) | 18% (16%, 19%) | 31% (29%, 32%) | 36% (34%, 38%) | 9% (7%, 12%) | 22% (20%, 25%) | 28% (25%, 30%) |
| Indonesia | 62% (60%, 65%) | - | 74% (72%, 76%) | 95% (94%, 96%) | - | 12% (8%, 15%) | 33% (30%, 35%) |
| Kenya | 19% (17%, 21%) | 36% (34%, 39%) | 65% (63%, 67%) | 68% (66%, 69%) | 18% (15%, 21%) | 47% (44%, 49%) | 49% (46%, 52%) |
| Mozambique | 21% (19%, 23%) | 61% (59%, 63%) | 68% (66%, 70%) | 61% (59%, 63%) | 40% (37%, 43%) | 47% (44%, 50%) | 40% (37%, 43%) |
| Nepal 1 | 42% (41%, 44%) | 64% (61%, 67%) | 82% (79%, 84%) | 99% (99%, 100%) | 22% (18%, 25%) | 40% (36%, 43%) | 57% (55%, 59%) |
| Nepal 2 | 27% (26%, 29%) | - | 86% (85%, 88%) | 94% (94%, 95%) | - | 59% (56%, 61%) | 67% (65%, 69%) |
| South Sudan | 14% (13%, 15%) | 15% (14%, 16%) | - | - | 1% (−1%, 3%) | - | - |
| Tanzania | 31% (29%, 33%) | 26% (24%, 28%) | 22% (20%, 24%) | 65% (63%, 67%) | −5% (−7%, −2%) | −9% (−11%, −6%) | 34% (31%, 37%) |
| Uganda | 15% (13%, 17%) | 52% (51%, 54%) | - | 78% (77%, 79%) | 38% (35%, 40%) | - | 63% (61%, 66%) |
| Zambia | 11% (9%, 13%) | 80% (79%, 82%) | 73% (71%, 75%) | 91% (90%, 92%) | 70% (67%, 72%) | 62% (59%, 65%) | 80% (78%, 83%) |
| Characteristics | R1 Prevalence (95% CI) | R2 Prevalence (95% CI) | R3 Prevalence (95% CI) | R4 Prevalence (95% CI) |
|---|---|---|---|---|
| Female headed households | ||||
| Yes | 19% (18%, 20%) | 43% (42%, 44%) | 61% (59%, 2%) | 73% (72%, 74%) |
| No | 22% (21%, 23%) | 49% (48%, 49%) | 63% (62%, 64%) | 75% (75%, 76%) |
| Households with any elderly | ||||
| Yes | 22% (21%, 22%) | 46% (45%, 47%) | 62% (61%, 63%) | 77% (76%, 78%) |
| No | 21% (20%, 22%) | 48% (47%, 9%) | 63% (62%, 64%) | 73% (72%, 74%) |
| Households with any disability | ||||
| Yes | 17% (15%, 18%) | 47% (43%, 51%) | 62% (58%, 66%) | 72% (68%, 75%) |
| No | 25% (24%, 26%) | 47% (46%, 48%) | 62% (62%, 63%) | 75% (74%, 76%) |
| Socioeconomic status | ||||
| Lowest two wealth quintiles | 20% (19%, 21%) | 41% (40%, 42%) | 61% (60%, 62%) | 72% (71%, 73%) |
| Highest two wealth quintiles | 24% (22%, 25%) | 55% (54%, 57%) | 72% (71%, 73%) | 81% (80%, 82%) |
| Country | Coverage Change for Female vs. Male Headed HHs | Coverage Change for HHs with Elderly Members vs. No Elderly Members | Coverage Change for HHs With Disabled Members vs. No Disabled Members | Coverage Change for HHs in Lowest Quintiles vs. Highest Two Quintiles |
|---|---|---|---|---|
| Bhutan | 6% (−4%, 15%) | −7% (−15%, 2%) | 1% (−14%, 17%) | 35% (23%, 48%) |
| Ethiopia | 6% (1%, 11%) | 2% (−1%, 6%) | 5% (−6%, 16%) | −9% (−13%, −5%) |
| Ghana | −11% (−18%, −4%) | 0% (−5%, 5%) | 10% (−2%, 21%) | −9% (−16%, −2%) |
| Indonesia | −3% (−11%, 5%) | −4% (−9%, 1%) | −1% (−12%, 11%) | 60% (56%, 64%) |
| Kenya | −5% (−11%, 1%) | 1% (−4%, 6%) | −7% (−17%, 3%) | 15% (8%, 22%) |
| Mozambique | −6% (−12%, 1%) | −1% (−7%, 6%) | −9% (−53%, 35%) | 27% (20%, 33%) |
| Nepal 1 | −31% (−36%, −26%) | 2% (−2%, 6%) | −23% (−29%, −17%) | 10% (3%, 17%) |
| Nepal 2 | −9% (−15%, −3%) | 3% (−2%, 7%) | 12% (4%, 20%) | −11% (−18%, −5%) |
| South Sudan * | −8% (−12%, −4%) | −6% (−10%, −2%) | 14% (6%, 21%) | 17% (10%, 24%) |
| Tanzania | 19% (12%, 25%) | 2% (−4%, 8%) | 6% (−9%, 21%) | 10% (2%, 18%) |
| Uganda | −3% (−9%, 2%) | 3% (−2%, 8%) | 1% (−8%, 9%) | −17% (−22%, −12%) |
| Zambia | −6% (−11%, 0%) | 5% (1%, 10%) | 1% (−10%, 11%) | −12% (−17%, −7%) |
References
- UN. UN General Assembly, Transforming our World: The 2030 Agenda for Sustainable Development. Available online: https://sustainabledevelopment.un.org/post2015/transformingourworld (accessed on 21 October 2018).
- UN. Sustainable Development Goals: About the Sustainable Development Goals. Available online: https://www.un.org/sustainabledevelopment/sustainable-development-goals/ (accessed on 6 December 2018).
- WHO. Core questions and indicators for monitoring WASH in health care facilities in the Sustainable Development Goals. Available online: https://washdata.org/sites/default/files/documents/reports/2019-04/JMP-2018-core-questions-for-monitoring-WinHCF.pdf (accessed on 1 October 2019).
- Garn, J.V.; Sclar, G.D.; Freeman, M.C.; Penakalapati, G.; Alexander, K.T.; Brooks, P.; Rehfuess, E.A.; Boisson, S.; Medlicott, K.O.; Clasen, T.F. The impact of sanitation interventions on latrine coverage and latrine use: A systematic review and meta-analysis. Int. J. Hyg. Environ. Health 2017, 220, 329–340. [Google Scholar] [CrossRef] [Green Version]
- Freeman, M.C.; Garn, J.V.; Sclar, G.D.; Boisson, S.; Medlicott, K.; Alexander, K.T.; Penakalapati, G.; Anderson, D.; Mahtani, A.G.; Grimes, J.E.T.; et al. The impact of sanitation on infectious disease and nutritional status: A systematic review and meta-analysis. Int. J. Hyg. Environ. Health 2017, 220, 928–949. [Google Scholar] [CrossRef]
- Clasen, T.; Boisson, S.; Routray, P.; Torondel, B.; Bell, M.; Cumming, O.; Ensink, J.; Freeman, M.; Jenkins, M.; Odagiri, M.; et al. Effectiveness of a rural sanitation programme on diarrhoea, soil-transmitted helminth infection, and child malnutrition in Odisha, India: A cluster-randomised trial. Lancet Glob. Health 2014, 2, 645–653. [Google Scholar] [CrossRef] [Green Version]
- Null, C.; Stewart, C.P.; Pickering, A.J.; Dentz, H.N.; Arnold, B.F.; Arnold, C.D.; Benjamin-Chung, J.; Clasen, T.; Dewey, K.G.; Fernald, L.C.H.; et al. Effects of water quality, sanitation, handwashing, and nutritional interventions on diarrhoea and child growth in rural Kenya: A cluster-randomised controlled trial. Lancet Glob. Health 2018, 6, 316–329. [Google Scholar] [CrossRef] [Green Version]
- Luby, S.P.; Rahman, M.; Arnold, B.F.; Unicomb, L.; Ashraf, S.; Winch, P.J.; Stewart, C.P.; Begum, F.; Hussain, F.; Benjamin-Chung, J.; et al. Effects of water quality, sanitation, handwashing, and nutritional interventions on diarrhoea and child growth in rural Bangladesh: A cluster randomised controlled trial. Lancet Glob. Health 2018, 6, 302–315. [Google Scholar] [CrossRef] [Green Version]
- The World Bank. Equitable and Sustainable Rural Sanitation at Scale: A Call to Action. Available online: https://www.worldbank.org/en/news/feature/2019/10/07/rural-sanitation-matters (accessed on 14 November 2019).
- Dandabathula, G.; Bhardwaj, P.; Burra, M.; Rao, P.V.V.P.; Rao, S.S. Impact assessment of India’s Swachh Bharat Mission-Clean India Campaign on acute diarrheal disease outbreaks: Yes, there is a positive change. J. Fam. Med. Prim. Care 2019, 8, 1202–1208. [Google Scholar] [CrossRef] [PubMed]
- Redman-MacLaren, M.; Barrington, D.J.; Harrington, H.; Cram, D.; Selep, J.; MacLaren, D. Water, sanitation and hygiene systems in Pacific Island schools to promote the health and education of girls and children with disability: A systematic scoping review. J. Water Sanit. Hyg. Dev. 2018, 8, 386–401. [Google Scholar] [CrossRef]
- Carolini, G.Y. Framing water, sanitation, and hygiene needs among female-headed households in Periurban Maputo, Mozambique. Am. J. Public Health 2012, 102, 256–261. [Google Scholar] [CrossRef] [PubMed]
- Islam, M.A. The Socio-economic Conditions of the Rural Elderly in Bangladesh: A Sociological Analysis. Ind. J. Gerontol. 2017, 31, 196–208. [Google Scholar]
- Cheizom, P.; Choden, T. Role of Rural Women in Sanitation and Hygiene: A Gender Study from Bhutan; SNV: Thimphu, Bhutan, 2014. [Google Scholar]
- Gross, E.; Günther, I. Why do households invest in sanitation in rural Benin:Health, wealth, or prestige? Water Resr. Res. 2014, 50, 8314–8329. [Google Scholar] [CrossRef]
- SNV. Sustainable Sanitation & Hygiene for All (SSH4A). Available online: http://www.snv.org/public/cms/sites/default/files/explore/download/ssh4a_factsheet_march_2014_0.pdf (accessed on 25 June 2018).
- Sigler, R.; Mahmoudi, L.; Graham, J.P. Analysis of behavioral change techniques in community-led total sanitation programs. Health Promot Int. 2015, 30, 16–28. [Google Scholar] [CrossRef] [Green Version]
- Venkataramanan, V.; Crocker, J.; Karon, A.; Bartram, J. Community-Led Total Sanitation: A Mixed-Methods Systematic Review of Evidence and Its Quality. Environ. Health Perspect. 2018, 126. [Google Scholar] [CrossRef] [PubMed]
- Crocker, J.; Saywell, D.; Bartram, J. Sustainability of community-led total sanitation outcomes: Evidence from Ethiopia and Ghana. Int. J. Hyg. Environ. Health 2017, 220, 551–557. [Google Scholar] [CrossRef] [PubMed]
- Hartung, C.; Anokwa, Y.; Brunette, W.; Lerer, A.; Tseng, C.; Borriello, G. Open Data Kit: Tools to Build Information Services for Developing Regions. Available online: http://www.nixdell.com/classes/Tech-for-the-underserved/Hartung.pdf (accessed on 13 November 2019).
- WHO; UNICEF. Progress on Drinking Water, Sanitation and Hygiene-2017: Update and SDG Baselines; WHO & UNICEF: Geneva, Switzerland, 2017. [Google Scholar]
- Chakraborty, N.M.; Fry, K.; Behl, R.; Longfield, K. Simplified Asset Indices to Measure Wealth and Equity in Health Programs: A Reliability and Validity Analysis Using Survey Data From 16 Countries. Glob. Health Sci. Pract. 2016, 4, 141–154. [Google Scholar] [CrossRef] [PubMed] [Green Version]
- WG. Washington Group on Disability Statistics, Short Set of Disability Questions. Available online: http://www.washingtongroup-disability.com/washington-group-question-sets/short-set-of-disability-questions (accessed on 30 September 2019).
- Murray, L.; Gloria, L.; Vimal, R. Labor Force Withdrawal of the Elderly in South Africa. In National Research Council (US) Committee on Population; National Academies Press (US): Washington, DC, USA, 2006. [Google Scholar]
- WHO; UNICEF. JMP: Ladder Chart. Available online: https://washdata.org/data/household#!/dashboard/new (accessed on 18 November 2019).
- Hulland, K.; Martin, N.; Dreibelbis, R.; DeBruicker, V.; Winch, P. What Factors Affect Sustained Adoption of Safe Water, Hygiene and Sanitation Technologies? 3ie Systematic Review Summary 2; International Initiative for Impact Evaluation (3ie): London, UK, 2015. [Google Scholar]
- Helgegren, I.; Rauch, S.; Cossio, C.; Landaeta, G.; McConville, J. Importance of triggers and veto-barriers for the implementation of sanitation in informal peri-urban settlements-The case of Cochabamba, Bolivia. PLoS ONE 2018, 13, e0193613. [Google Scholar] [CrossRef] [Green Version]
- O’Reilly, K.; Louis, E. The toilet tripod: Understanding successful sanitation in rural India. Health Place 2014, 29, 43–51. [Google Scholar] [CrossRef] [Green Version]
- Peter, H. Community-led total sanitation, Zambia: Stick, carrot or balloon? Waterlines 2012, 30, 95–105. [Google Scholar]
- Tumwebaze, I.K.; Orach, C.G.; Nakayaga, J.K.; Karamagi, C.; Luethi, C.; Niwagaba, C. Ecological Sanitation Coverage and Factors Affecting its Uptake in Kabale Municipality, Western Uganda. Int. J. Environ. Health Res. 2011, 21, 294–305. [Google Scholar] [CrossRef]
- White, S.; Kuper, H.; Itimu-Phiri, A.; Holm, R.; Biran, A. A Qualitative Study of Barriers to Accessing Water, Sanitation and Hygiene for Disabled People in Malawi. PLoS ONE 2016, 11, e0155043. [Google Scholar] [CrossRef] [Green Version]
- Akter, T.; Ali, A.R.; Dey, N.C. Transition overtime in household latrine use in rural Bangladesh: A longitudinal cohort study. Public Health 2014, 14, 721. [Google Scholar] [CrossRef] [Green Version]
- Routray, P.; Schmidt, W.P.; Boisson, S.; Clasen, T.; Jenkins, M.W. Socio-cultural and behavioural factors constraining latrine adoption in rural coastal Odisha: An exploratory qualitative study. Public Health 2015, 15, 880. [Google Scholar] [CrossRef] [PubMed] [Green Version]
- Tsinda, A.; Abbott, P.; Pedley, S.; Charles, K.; Adogo, J.; Okurut, K.; Chenoweth, J. Challenges to achieving sustainable sanitation in informal settlements of Kigali, Rwanda. Int. J. Environ. Res. Public Health 2013, 10, 6939–6954. [Google Scholar] [CrossRef] [PubMed]
- Van Minh, H.; Nguyen-Viet, H.; Thanh, N.H.; Yang, J.C. Assessing willingness to pay for improved sanitation in rural Vietnam. Environ. Health Prev. Med. 2013, 18, 275–284. [Google Scholar] [CrossRef] [PubMed] [Green Version]
- HRW. World Report 2019: South Sudan. Available online: https://www.hrw.org/world-report/2019/country-chapters/south-sudan (accessed on 1 October 2019).
- ISF-UTS; SNV. Sanitation for All: A Comparative Study of Approaches to Leaving no One Behind Across Five Countries, Prepared for SNV Sustainable Sanitation and Hygiene for All (SSH4A) Programme; SNV: Hague, The Netherlands, 2018. [Google Scholar]
- Halcrow, G.; Rautavuoma, P.; Choden, T. Tailoring Pro-Poor Support Strategies with Local Governments to Improve Sanitation Services; SNV Netherlands Development Organisation: Hague, The Netherlands, 2014. [Google Scholar]
- Evans, B.; van der Voorden, C.; Peal, A. Public Funding for Sanitation: The Many Faces of Sanitation Subsidies; Water Supply & Sanitation Collaborative Council: Geneva, Switzerland, 2009. [Google Scholar]
- SNV. Ghana–SSH4A Results Programme Endline Brief. Available online: http://www.snv.org/public/cms/sites/default/files/explore/download/2017-ssh4a-rpendlinepracticebrief-ghana_0.pdf (accessed on 13 May 2018).
- Kenya. Ministry of Health: Kenya Environmental Sanitation and Hygiene 2016–2030. Available online: http://sanitationandwaterforall.org/wp-content/uploads/download-managerfiles/KESH%20POLICY_1.pdf (accessed on 5 June 2018).
- World Bank. Water Supply and Sanitation in Mozambique: Turning Finance into Services for 2015 and Beyond; World Bank: Washington, DC, USA, 2011. [Google Scholar]
- SNV. Nepal–SSH4A Results Programme First Mid-term Review Brief. Available online: http://www.snv.org/public/cms/sites/default/files/explore/download/2017-ssh4a-rp-yearonemtrpracticebrief-nepal.pdf (accessed on 13 May 2018).
- Ekane, N.; Weitz, N.; Nykvist, B.; Nordqvis, P.; Noel, S. Comparative Assessment of Sanitation and Hygiene Policies and Institutional Frameworks in Rwanda, Uganda and Tanzania; Stockholm Environment Institute: Stockholm, Sweden, 2016. [Google Scholar]
- Robinson, A. Enabling Environment Endline Assessment: Tanzania; Water and Sanitation Program: Washington, DC, USA, 2011. [Google Scholar]
- SNV. Tanzania–SSH4A Results Programme First: A Mid-term Review Brief. Available online: http://www.snv.org/public/cms/sites/default/files/explore/download/2017-ssh4a-rp-yearonemtrpracticebrief-tanzania_0.pdf (accessed on 13 May 2018).
- Tyndale-Biscoe, P.; Bond, M.; Kidd, R. Plan International: ODF Sustainability Study. Available online: http://fhdesigns.com.au/Documents/ODF%20Study/Plan%20International%20ODF%20Sustainability%20Study-Final%20Report.pdf (accessed on 20 May 2018).
- GSF. Local Governance and Sanitation: Eight lessons from Community-Led Total Sanitation at Scale through Local Governments in Uganda. Available online: https://www.communityledtotalsanitation.org/sites/communityledtotalsanitation.org/files/Eight_lessons_CLTS_Uganda.pdf (accessed on 24 June 2018).
- SNV. Uganda–SSH4A Results Programme First Mid-term Review Brief. Available online: http://www.snv.org/public/cms/sites/default/files/explore/download/2018-ssh4a-rp-yearonemtrpracticebrief-uganda.pdf (accessed on 13 May 2018).
- SNV. Zambia–SSH4A Results Programme First Mid-term Brief. Available online: http://www.snv.org/public/cms/sites/default/files/explore/download/2017-ssh4a-rp-yearonemtrpracticebrief-zambia.pdf (accessed on 13 May 2018).


| Characteristics | Bhutan | Ethiopia | Ghana | Indonesia | Kenya | Mozambique | Nepal 1 1 | Nepal 2 1 | South Sudan | Tanzania | Uganda | Zambia |
|---|---|---|---|---|---|---|---|---|---|---|---|---|
| Total living in program area 2 | 95,111 | 454,255 | 469,964 | 174,547 | 816,934 | 1,267,424 | 460,873 | 521,548 | 487,105 | 996,535 | 2,033,442 | 541,063 |
| Total sampled | 751 | 2167 | 2112 | 2039 | 1953 | 1888 | 2979 | 2492 | 2131 | 2177 | 2055 | 1061 |
| Female headed household (%) 3 | 214 (25) | 490 (23) | 274 (17) | 197 (10) | 428 (23) | 451 (24) | 554 (16) | 372 (15) | 736 (33) | 427 (20) | 473 (23) | 282 (26) |
| Households with any person with disability (%) 3 | 57 (7) | 53 (2) | 226 (12) | 89 (5) | 227 (11) | 71 (4) | 410 (10) | 226 (9) | 187 (8) | 353 (17) | 220 (12) | 98 (9) |
| Households with any elderly (%) 3,4 | 459 (62) | 849 (39) | 1431 (70) | 978 (48) | 1101 (56) | 461 (24) | 1749 (60) | 1572 (65) | 1259 (61) | 1071 (49) | 956 (49) | 421 (39) |
| Households wealth quintiles 5 | ||||||||||||
| Lowest two quintiles (%) | 163 (44) | 851 (39) | 773 (36) | 1046 (47) | 1384 (68) | 519 (28) | 1990 (57) | 1269 (51) | 86 (4) | 551 (23) | 790 (40) | 429 (40) |
| Middle quintile (%) | 121 (33) | 449 (21) | 466 (22) | 530 (27) | 288 (17) | 440 (23) | 761 (32) | 976 (39) | 433 (20) | 925 (43) | 412 (20) | 229 (22) |
| Highest two quintiles (%) | 86 (23) | 867 (40) | 873 (41) | 463 (25) | 281 (16) | 929 (49) | 228 (11) | 247 (10) | 1612 (76) | 701 (33) | 853 (40) | 403 (38) |
| Number of HH members, mean (SD) | 4.6 (0.08) | 4.8 (0.05) | 10 (0.16) | 4.1 (0.04) | 8 (0.16) | 4.2 (0.06) | 6.8 (0.06) | 7.1 (0.08) | 7.3 (0.09) | 7.3 (0.1) | 7.9 (0.31) | 5.4 (0.09) |
| Program Area | Baseline Sanitation Prevalence (95% CI) | Final Follow-up Sanitation Prevalence (95% CI) | Baseline to Final Difference (95% CI) | Estimated Population that Gained Toilet Access |
|---|---|---|---|---|
| Bhutan | 62% (58%, 65%) | 92% (90%, 94%) | +30% (26%, 34%) | 28,835 |
| Ethiopia | 19% (17%, 20%) | 95% (95%, 96%) | +77% (75%, 79%) | 422,469 |
| Ghana | 8% (7%, 10%) | 36% (34%, 38%) | +28% (25%, 30%) | 146,331 |
| Indonesia | 62% (60%, 65%) | 95% (94%, 96%) | +33% (30%, 35%) | 56,309 |
| Kenya | 19% (17%, 21%) | 68% (66%, 69%) | +49% (46%, 52%) | 446,967 |
| Mozambique | 21% (19%, 23%) | 61% (59%, 63%) | +40% (37%, 43%) | 608,361 |
| Nepal 1 | 42% (41%, 44%) | 99% (99%, 100%) | +57% (55%, 59%) | 283,219 |
| Nepal 2 | 27% (26%, 29%) | 94% (94%, 95%) | +67% (65%, 69%) | 375,077 |
| South Sudan | 14% (13%, 15%) | 15% (14%, 16%) 1 | +1% (−1%, 3%) 1 | 6452 1 |
| Tanzania | 31% (29%, 33%) | 65% (63%, 67%) | +34% (31%, 37%) | 390,957 |
| Uganda | 15% (13%, 17%) | 78% (77%, 79%) | +63% (61%, 66%) | 1,480,076 |
| Zambia | 11% (9%, 13%) | 91% (90%, 92%) | +80% (78%, 83%) | 555,658 |
| Country | JMP Basic Sanitation Coverage in 2014 | JMP Basic Sanitation Coverage in 2017 | JMP Basic Sanitation Difference |
|---|---|---|---|
| Bhutan | 66% | 69% | +3% |
| Ethiopia | 7% | 7% | 0% |
| Ghana | 16% | 18% | +2% |
| Indonesia | 68% | 73% | +5% |
| Kenya | 30% | 29% | −1% |
| Mozambique | 26% | 29% | +3% |
| Nepal | 53% | 62% | +9% |
| South Sudan | 9% | 11% | +2% |
| Tanzania | 3% | 5% | +2% |
| Uganda | 18% | 18% | 0% |
| Zambia | 26% | 26% | 0% |
| Program Area | Baseline Safe Disposal Prevalence (95% CI) | Final Follow-up Safe Disposal Prevalence (95% CI) | Baseline to Final Difference (95% CI) |
|---|---|---|---|
| Bhutan | 37% (29%, 46%) | 34% (25%, 43%) | −4% (−16%, 9%) 1 |
| Ethiopia | 16% (13%, 19%) | 97% (96%, 99%) | +81% (78%, 84%) |
| Ghana | 10% (7%, 13%) | 47% (44%, 50%) | +37% (33%, 41%) |
| Indonesia | 49% (42%, 56%) | 79% (74%, 84%) | + 30% (22%, 39%) |
| Kenya | 35% (32%, 39%) | 69% (66%, 72%) | +34% (29%, 38%) |
| Mozambique | 43% (40%, 47%) | 68% (63%, 72%) | +24% (18%, 30%) |
| Nepal 1 | 28% (25%, 30%) | 87% (83%, 91%) | + 59% (54%, 64%) |
| Nepal 2 | 20% (17%, 23%) | 69% (66%, 73%) | +49% (44%, 54%) |
| South Sudan | 21% (19%, 23%) | 25% (22%, 27%) | +3% (0%, 7%) 1 |
| Tanzania | 61% (58%, 64%) | 96% (94%, 97%) | +35% (31%, 38%) |
| Uganda | 71% (68%, 75%) | 92% (91%, 94%) | +21% (17%, 25%) |
| Zambia | 38% (33%, 42%) | 94% (92%, 96%) | +56% (51%, 61%) |
| Program Area | Baseline HW Station Prevalence (95% CI) | Final Follow-up HW Station Prevalence (95% CI) | Baseline to Final Difference (95% CI) |
|---|---|---|---|
| Bhutan | 33% (29%, 37%) | 65% (62%, 69%) | +32% (27%, 37%) |
| Ethiopia | 0% (0%, 0%) | 26% (24%, 28%) | +26% (24%, 28%) |
| Ghana | 0% (0%, 1%) | 11% (10%, 12%) | +11% (10%, 12%) |
| Indonesia | 16% (14%, 18%) | 36% (34%, 39%) | +20% (17%, 23%) |
| Kenya | 1% (0%, 1%) | 10% (9%, 11%) | +9% (8%, 10%) |
| Mozambique | 4% (3%, 4%) | 16% (15%, 18%) | +13% (11%, 14%) |
| Nepal 1 | 8% (7%, 9%) | 77% (74%, 79%) | +69% (66%, 72%) |
| Nepal 2 | 6% (5%, 7%) | 76% (75%, 78%) | +70% (68%, 72%) |
| South Sudan | 2% (2%, 3%) | 1% (1%, 1%) 1 | −1 (−2%, −1%) 1 |
| Tanzania | 0% (0%, 1%) | 35% (33%, 37%) | +34% (32%, 37%) |
| Uganda | 1% (0%, 1%) | 4% (3%, 4%) | +3% (2%, 4%) |
| Zambia | 0% (0%, 0%) | 24% (22%, 26%) | +23% (21%, 25%) |
| Characteristics | Baseline Sanitation Prevalence (95%CI) | Endline Sanitation Prevalence (95%CI) | Baseline to Endline Difference (95% CI) | Difference in Differences (95% CI) |
|---|---|---|---|---|
| Female headed households | ||||
| Yes | 19% (18%, 21%) | 73% (72%, 74%) | 54% (52%, 56%) | 0.5% (−1.7%, 2.6%) |
| No | 22% (21%, 23%) | 75% (75%, 76%) | 53% (52%, 54%) | |
| Households with any elderly | ||||
| Yes | 22% (21%, 23%) | 77% (76%, 78%) | 55% (54%, 56%) | 3.2% (1.3%, 5.0%) |
| No | 21% (20%, 22%) | 73% (72%, 74%) | 52% (51%, 53%) | |
| Households with any disability | ||||
| Yes | 19% (17%, 21%) | 72% (68%, 76%) | 53% (49%, 57%) | 0.0% (−4.3%, 4.4%) |
| No | 22% (21%, 22%) | 75% (74%, 76%) | 53% (52%, 54%) | |
| Socioeconomic status | ||||
| Lowest two wealth quintiles | 20% (19%, 21%) | 72% (71%, 73%) | 52% (51%, 53%) | −5.3% (−7.5%, −3.1%) |
| Highest two wealth quintiles | 24% (22%, 25%) | 81% (80%, 82%) | 57% (56%, 59%) | |
© 2020 by the authors. Licensee MDPI, Basel, Switzerland. This article is an open access article distributed under the terms and conditions of the Creative Commons Attribution (CC BY) license (http://creativecommons.org/licenses/by/4.0/).
Share and Cite
Apanga, P.A.; Garn, J.V.; Sakas, Z.; Freeman, M.C. Assessing the Impact and Equity of an Integrated Rural Sanitation Approach: A Longitudinal Evaluation in 11 Sub-Saharan Africa and Asian Countries. Int. J. Environ. Res. Public Health 2020, 17, 1808. https://doi.org/10.3390/ijerph17051808
Apanga PA, Garn JV, Sakas Z, Freeman MC. Assessing the Impact and Equity of an Integrated Rural Sanitation Approach: A Longitudinal Evaluation in 11 Sub-Saharan Africa and Asian Countries. International Journal of Environmental Research and Public Health. 2020; 17(5):1808. https://doi.org/10.3390/ijerph17051808
Chicago/Turabian StyleApanga, Paschal A., Joshua V. Garn, Zoe Sakas, and Matthew C. Freeman. 2020. "Assessing the Impact and Equity of an Integrated Rural Sanitation Approach: A Longitudinal Evaluation in 11 Sub-Saharan Africa and Asian Countries" International Journal of Environmental Research and Public Health 17, no. 5: 1808. https://doi.org/10.3390/ijerph17051808