Article Text

Abstract
Background Brazil boasts a health scheme that aspires to provide universal coverage, but its surgical system has rarely been analysed. In an effort to strengthen surgical systems worldwide, the Lancet Commission on Global Surgery proposed a collection of 6 standardised indicators: 2-hour access to surgery, surgical workforce density, surgical volume, perioperative mortality rate (POMR) and protection against impoverishing and catastrophic expenditure. This study aims to characterise the Brazilian surgical health system with these newly devised indicators while gaining understanding on the complexity of the indicators themselves.
Methods Using Brazil's national healthcare database, commonly reported healthcare variables were used to calculate or simulate the 6 surgical indicators. Access to surgery was calculated using hospital locations, surgical workforce density was calculated using locations of surgeons, anaesthesiologists and obstetricians (SAO), and surgical volume and POMR were identified with surgical procedure codes. The rates of protection against impoverishing and catastrophic expenditure were modelled using cost of surgical inpatient hospitalisations and a γ distribution of incomes based on Gini and gross domestic product/capita.
Findings In 2014, SAO density was 34.7/100 000 population, surgical volume was 4433 procedures/100 000 people and POMR was 1.71%. 79.4% of surgical patients were protected against impoverishing expenditure and 84.6% were protected against catastrophic expenditure due to surgery each year. 2-hour access to surgery was not able to be calculated from national health data, but a proxy measure suggested that 97.2% of the population has 2-hour access to a hospital that may be able to provide surgery. Geographic disparities were seen in all indicators.
Interpretation Brazil's public surgical system meets several key benchmarks. Geographic disparities, however, are substantial and raise concerns of equity. Policies should focus on stimulating appropriate geographic allocation of the surgical workforce and better distribution of surgical volume. In some cases, where benchmarks for each indicator are met, supplemental analysis can further inform our understanding of health systems. This measured and systematic evaluation should be encouraged for all nations seeking to better understand their surgical systems.
This is an Open Access article distributed in accordance with the Creative Commons Attribution Non Commercial (CC BY-NC 4.0) license, which permits others to distribute, remix, adapt, build upon this work non-commercially, and license their derivative works on different terms, provided the original work is properly cited and the use is non-commercial. See: http://creativecommons.org/licenses/by-nc/4.0/
Statistics from Altmetric.com
Key questions
What is already known about this topic?
There is a substantial lack of surgical monitoring and evaluation worldwide.
The Lancet Commission on Global Surgery (LCoGS) proposed the six surgical indicators used in the present study.
Geographic disparities in the trainee and physician workforce have been reported, though no other studies were identified that characteriszed other elements of the surgical system of Brazil.
What are the new findings?
This is the first comprehensive and critical analysis of the surgical indicators proposed by LCoGS in any country, demonstrating that the collection of surgical system indicators is possible where national health data are recorded.
This study provides an in-depth, multifactorial assessment of Brazil's surgical system while also identifying and quantifying geographic disparities that exist.
Recommendations for the LCoGS surgical indicators and for the Brazilian surgical system are summarised in table 3.
Recommendations for policy
Facility-level evaluation and adjunct indicators may be needed for more in-depth evaluation of surgical systems. In Brazil, a critical look at geographic disparities is essential for improving equity in access to care.
Introduction
In a 2015 report, the Lancet Commission on Global Surgery (LCoGS) estimated that over five billion people lack access to safe, affordable and timely surgical care worldwide and that an additional 143 million surgical procedures are needed annually to meet global needs.1 ,2 Recognising the critical role of measurement in understanding and tracking the state of a surgical system, LCoGS proposed six standardised indicators, with associated benchmarks for two of them (table 1) and advocated for the incorporation of these indicators into existing mechanisms for health system assessments. While these indicators were developed through an expansive and iterative expert consultation, they have not yet been comprehensively applied at the national level.
Six Lancet indicators for measurement and assessment of global surgical systems
Brazil, the world's fifth most populous country, aspires to provide universal health coverage. As such, it is an optimal pilot site for studying these indicators. The country is comprised of five regions, which are further divided into 26 states and a federal district. In the 1980s, Brazil was the world's most unequal country3 with the South and Southeast regions representing a significantly wealthier population than the rest of the country. Nevertheless, the nation has experienced rapid economic growth and decreasing inequality, leading to demands for better public services, including improvements in healthcare.4
For many health indicators, the country has made improvements: life expectancy in Brazil has increased by nearly 20 years in the past four decades5 and maternal mortality has nearly been cut in half.6 The government's health scheme, Sistema Único de Saúde (SUS) or the Unified Health System, is credited for many of these improvements as the largest public healthcare system in the world, guaranteeing healthcare to 100% of the Brazilian population.7 It is federally funded with additional tax revenues and social contributions from the individual states and municipalities. The financing for SUS is largely governed at the federal level, though healthcare administration and management is left to states and municipalities.7 Unfortunately, SUS is vulnerable to the geographic and economic disparities that beleaguer the country. For example, 65.9% of doctors in Brazil practise in the state capitals while only 24% of the national population lives there.8 Similarly, only 56% of physicians practising in the North completed residency training compared with 78% of physicians practising in the Southeast.8
This maldistribution of services is seen in the surgical disciplines as well. Surgical residency began in Southeastern cities in 1948, and even in 2008, 73% of general surgery training positions remained in the South and Southeast.9 While disparity in availability and quality of surgical care is widely acknowledged,8–10 it has not yet been systematically studied.
The primary goal of this study is to characterise the Brazilian surgical health system according to the six indicators proposed by LCoGS. In doing so, we will provide an in-depth assessment of Brazil's surgical system while also identifying and quantifying geographic disparities that exist. We also use Brazil to gain further understanding of the complexity of these newly proposed indicators.
Methods
Data were obtained from national, open-access databases that are organised and maintained by the government. DATASUS is the online portal for an administrative database Sistema de Informações Hospitalares/Sistema Único de Saúde (SIH/SUS) (http://www2.datasus.gov.br). SIH/SUS categorises all SUS payments for hospitalisations and procedures and has been used in numerous studies.11 Instituto Brasileiro de Geografia e Estatistica (IBGE) is the national geographic and statistical database (http://www.ibge.gov.br). We accessed all databases in September 2015.
Indicator 1: 2-hour access to surgery
In the LCoGS, 2-hour access to surgery is defined as the proportion of the population that can access a facility that can perform caesarean delivery, laparotomy and open fracture repairs within 2 hours.1 Since facility-level data on these procedures were unavailable, we queried the Cadastro Nacional de Establecimentos de Saúde (CNES), a portal within DATASUS, for public hospitals that employ at least one surgeon, anaesthesiologist and obstetrician, and have a doctor on call 24 hours per day. As such, we were unable to calculate a true indicator 1 and the provided list is simply a proxy measure.
Using proprietary software from Redivis (https://http://www.redivis.com), the geographic location of these hospitals was mapped and 2-hour distance was calculated. Hospital location was entered using latitude and longitude and 2-hour distance was estimated using known speed limits for roads and highways and average walking speed where no roads were present. Finally, the geographic area of the map generated to simulate 2-hour access was compared against the population density, from WorldPop (http://www.worldpop.org.uk), to calculate the percentage of the population with 2-hour access to an included facility.
Indicator 2: surgical workforce density
Surgeons, anaesthesiologists and obstetricians (SAO) were identified from CNES, which includes a count of all professionals registered in a municipality, for 2014. ‘Surgeons’ included general surgeons, surgical oncologists, cardiovascular surgeons, orthopaedic surgeons, hand surgeons, otolaryngologists, head and neck surgeons, paediatric surgeons, plastic surgeons, thoracic surgeons, vascular surgeons, ophthalmologists, urologists and neurosurgeons. ‘Anaesthesiologist’ and ‘obstetricians’ were categorised as such in DATASUS. A population estimate was obtained from IBGE and is based on census data and projected growth. The surgical workforce density that we reported was the total number of SAO per 100 000 population and was calculated separately for each state, region and for the country.
Indicator 3: surgical volume
Surgical volume was identified using annual numbers registered in DATASUS for the year 2014. We included both inpatient and ambulatory surgeries in these fields: endocrine, peripheral and central nervous system, head and neck, ophthalmological, vascular, gastrointestinal and abdominal, orthopaedic, genitourinary, breast, obstetric and gynaecological, thoracic, reconstructive and oncological. Exclusion criteria included anaesthetic and dental procedures.
Indicator 4: perioperative mortality rate
DATASUS reports mortality data on any deaths occurring during an inpatient hospitalisation. Perioperative mortality rate (POMR) was calculated using inpatient mortality that occurred during a hospitalisation in which a patient underwent a procedure.
Indicator 5: protection against impoverishing expenditure
This indicator is defined as the proportion of households protected against impoverishment from out-of-pocket payment for surgical and anaesthetic care. To determine impoverishment, we used the nationally determined poverty line.12 The threshold for impoverishing expenditure would be any income below:
For the cost of surgery, we used average cost of surgery to SUS in Brazilian Reals, from 2008 to 2014, as reported in DATASUS. This value reflects the total cost to SUS of an inpatient hospitalisation and associated costs during which the patient underwent a surgical procedure, as defined above. The expected proportion of out-of-pocket expenditure for healthcare is provided by the World Bank.13 A well-validated descriptive model of income distribution, the γ distribution, was used to generate income distributions for the country, regions and states.14 gross domestic product (GDP) per capita and the Gini Index were used as model parameters. The percentage of protection against impoverishing expenditure is the percentage of all incomes in the distribution that remains above the poverty line after the cost of surgery was deducted.
Indicator 6: protection against catastrophic expenditure
Methods for determining income distributions are the same as in indicator 5. Catastrophic expenditure, however, is defined as out-of-pocket expenditure on surgical and anaesthetic care that is > 40% of the patient's postsubsistence income where postsubsistence income is the household income after food expenditure. Thus, the threshold for catastrophic expenditure is any income below:
As in indicator 5, this income distribution was then compared against the cost of surgery to determine the percentage of people protected against catastrophic expenditure. Food expenditure data are available from 2008 at the state level. State food expenditure levels were modelled using the national economic index for the years 2009–2014.
Ethics statement
This study was conducted according to the principles expressed in the Declaration of Helsinki. This study was granted an International Review Board (IRB) exemption by Boston Children's Hospital and an ethics exemption from the Faculdade de Medicina da Universidade de São Paulo. The authors have no conflicts of interest and there was no funding source for this study.
Statistical analysis
To compare the regional variation in modelled parameters (indicators 5 and 6), analysis of variance was performed. No statistical analysis was performed on tabulated data (indicators 2–4). All statistical analyses were performed using statistical program R and Microsoft Excel. Geographic mapping and analysis was performed using the geographic information system package QGIS to visualise geospatial information generated or tabulated in R and Microsoft Excel.
Results
Indicator 1: 2-hour access to surgery
Our query from the CNES yielded 1247 hospitals that met criteria nationwide. We calculate a proxy measure for indicator 1 in which 97·2% of the population of Brazil has 2-hour access to a facility that may be able to provide surgery.
Indicator 2: surgical workforce density
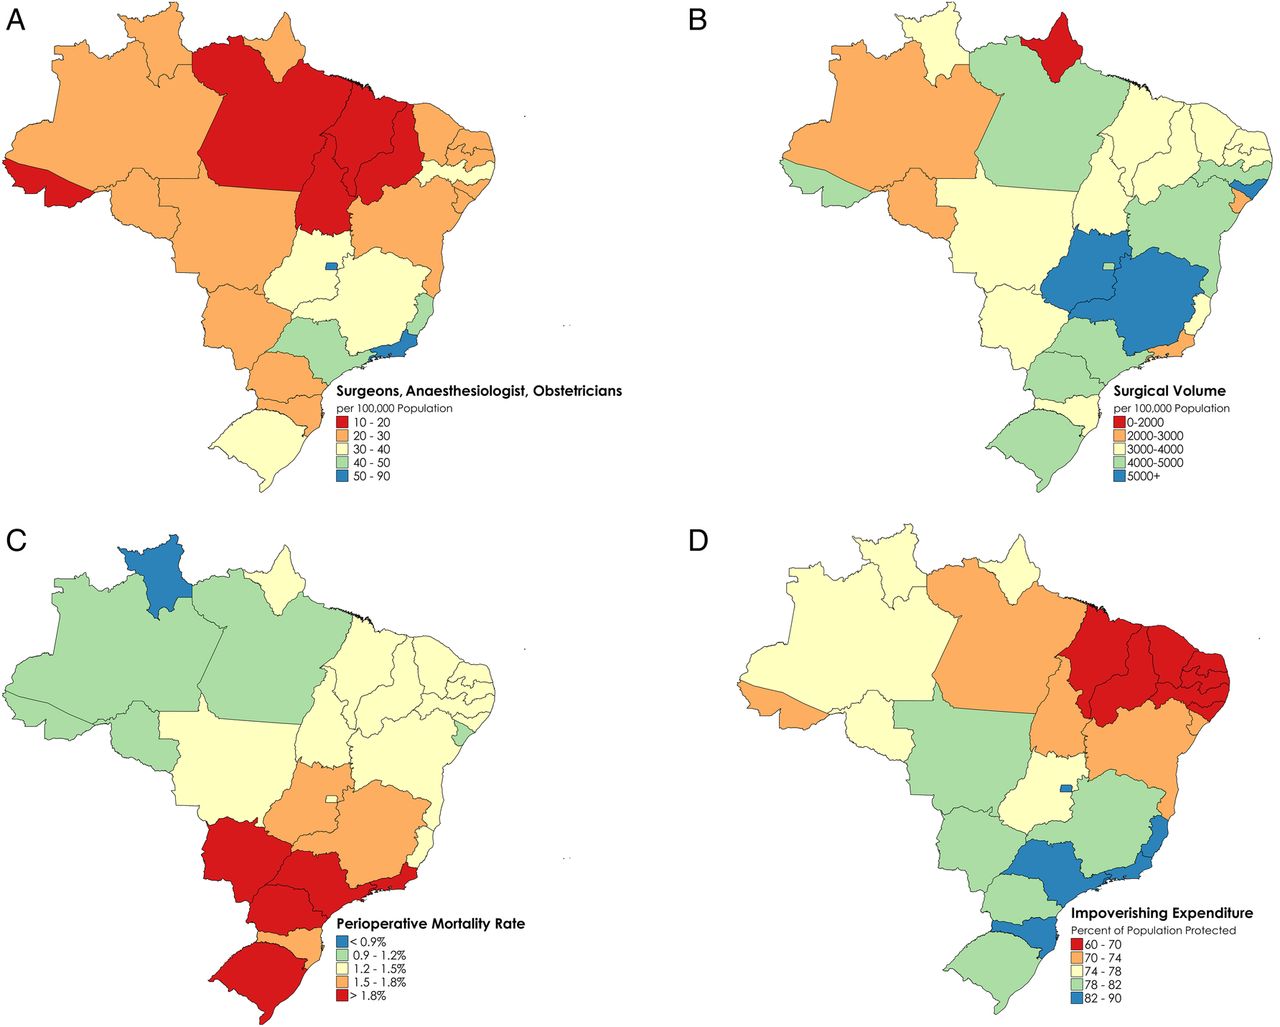
The surgical workforce density was 34.7 SAO per 100 000 population in 2014 (table 2, see online supplementary appendix 1). Geographically, this ranges from 18.4 SAO per 100 000 people in the North Region, to 45.81 SAO per 100 000 people in the Southeast, in 2014 (figure 1A and table 2). Of the total 70 449 SAO in Brazil, 40 808 are surgeons (58.9% of the surgical workforce), 11 492 are anaesthesiologists (16.3%) and 18 149 are obstetricians (25.8%).
supplementary appendix
Indicators 2–6 for each region in Brazil, in the year 2014
(A) Indicator 2: total surgeon, anaesthesiologist and obstetrician workforce density per 100 000 people, by state in the year 2014. (B) Indicator 3: total surgical volume per 100 000 people, by state in the year 2014. (C) Indicator 4: perioperative mortality rate by state in the year 2014. (D) Indicator 5: protection against impoverishing expenditure by state in the year 2014.
The density of the surgical workforce that operates in the public sector drops to 23.0 SAO per 100 000 people. In total, 57.9% of all surgeons, 82.7% of all anaesthesiologists and 63.1% of all obstetricians maintain a job in the public sector.
Indicator 3: surgical volume
Surgical volume in the public sector was 4433 surgeries per 100 000 people in 2014. Geographically, this ranges from 3518 surgeries per 100 000 people per year in the North Region, to 5151 surgeries per 100 000 people per year in the Central West, in 2014 (figure 1B and table 2).
Indicator 4: POMR
POMR was 1·71% in 2014, ranging from 1.12% in the North to 2.13% in the South in 2014 (figure 1C and table 2). The mean inpatient stay for a surgical admission in Brazil was 3.6 days in 2014.
The POMR for a caesarean section alone is 0.034% in Brazil. The rate is highest in the Northeast (0.037%) and lowest in the South Region (0.025%).
Indicator 5: protection against impoverishing expenditure
Protection against impoverishing expenditure was 79.4% in 2014, ranging from 68.7% in the Northeast Region to 82.3% in the Central West Region in 2014 (figure 1D and table 2).
Indicator 6: protection against catastrophic expenditure
Protection against catastrophic expenditure was 84.6% in 2014, ranging from 78.5% in the Northeast Region to 87.2% in the Central West Region in 2014 (table 2).
Discussion
We used the Brazilian public health sector database to characterise Brazil's surgical system according to six indicators. On the basis of limited international data, we find that Brazil falls within the range of values seen by other upper middle-income countries and performs substantially better than low-income countries.1 ,15 Moreover, we find that Brazil approaches or meets benchmarks that suggest an adequate national workforce and surgical volume; yet the country suffers from problems of geographic distribution and equity. This analysis of the surgical system is timely in the light of a recent survey of the Brazilian public which found that 93% of people have a negative perception of Brazilian healthcare, with access to surgery as the largest perceived problem.10
Despite the existence of a national health programme, regional variation in the surgical indicators mirror economic and health disparities in the country. The North and Northeast, the two poorest regions of Brazil, have a lower density of surgical providers, fewer surgical procedures performed per capita and more patients are impoverished due to surgery. In some cases, the disparity is severe. In the Northeastern state of Piauí, nearly 40% of patients, twice the national figure, are impoverished due to surgical costs. Additionally, in the Northeastern state of Maranhão, there are eight times fewer SAO/100 000 people than in the capital district of Brasilia (11.4 vs 88.6, respectively).
Workforce shortages have long been perceived to be a problem in the Brazilian health system.16 The previous literature on the surgical workforce in Brazil has shown similar trends that we have identified, though the numbers differ slightly as distinct data sources were used.17 For specialist surgical care, we found that the wealthier regions meet the benchmarks for density of surgical providers but that the poorer North and Northeastern regions in Brazil barely meet the threshold of 20–40 SAO/100 000 that is a suggested minimum to meet a region's needs.1 ,18 To address a general shortage of doctors, in 2013 the Brazilian government launched the Mais Médicos (More Doctors) scheme.19 The scheme's primary focus is on increasing the number of primary care doctors and strengthening primary healthcare units.19 In addition to this, the scheme strives to increase medical school enrolment outside of state capitals and create 12 400 residency spots by 2018; the goal of this scheme is to ensure that every Brazilian medical graduate is able to pursue postgraduate training and that they are able to do so closer to the communities they come from.19
While the focus of this effort is on increasing training for primary care specialties, a parallel effort in surgical care is warranted. Increasing surgical and anaesthesia training in rural areas may be a useful retention strategy for the rural surgical workforce, as has been demonstrated at a hospital in Kenya.20 The development of a National Specialist Registration, currently underway, is likely to assist in identifying targets for public policies on specialist training.19 For example, there is a shortage of anaesthesiologists—the SAO workforce in Brazil comprises 16.3% anaesthesiologists, under the worldwide median of 20%15—suggesting that reallocating residency spots may be useful.
Apart from geographic analyses, in a country such as Brazil where broad benchmarks of SAO density are met, additional disaggregation is also valuable. We find, for example, that the SAO density of public sector providers is lower than that of overall providers by nearly 12 per 100 000. True availability is most likely even worse than our numbers show: in Brazil, over half of all of the physicians have three or more job positions and 70.5% of all physicians in the public sector also work in the private sector.16 The distribution of time each specialist spends in the public versus private sector may be heavily biased towards the private sector. Thus, consideration of public full-time equivalents may give a more accurate picture of the surgical workforce available to the 75–80% of Brazilians who rely exclusively on SUS.21
In Brazil, the national surgical volume of 4337 procedures/100 000 in the public sector alone is close to the suggested minimum of 5000 procedures/100 000. In light of this, it is important to turn attention to the quality and case-mix of the surgeries being performed and the appropriateness of personnel to do them. In particular, selective overprovision of surgeries such as caesarean section22–24 may be harmful to patients and draw resources away from the provision of other necessary procedures.
Additionally, an integrated consideration of the indicators is valuable. We find, for example, that the state of Rio de Janeiro has a high workforce density yet provides a very low number of procedures in the public sector, yielding a ratio of 41.7 procedures per SAO provider. The state of Pará, conversely, has high public sector output with a low workforce density, with a ratio of 305.2 procedures per SAO provider. These findings may be driven by the fact that surgeons in Rio disproportionately provide care in the private sector. Further investigation into this type of variation is warranted.
Our study also found that inpatient POMR demonstrates a counterintuitive geographic disparity. The South and Southeastern states, which have a greater proportion of academic surgical programmes,9 suffer a considerably higher POMR than the Northern and Northeastern states. This may, in part, be driven by different patient populations, different physician behaviour or under-reporting of mortality. In the South and Southeast, more highly trained surgeons with greater resources may perform higher complexity procedures on patients with greater comorbidities, thereby driving up POMR. POMR for caesarean section alone, a procedure for which there is less variation of risk, demonstrates the expected findings of lower POMR in the South and Southeast than in the North and Northeast. An additional factor may be under-reporting of mortality, which is known to occur with greater frequency in the North and Northeast of Brazil than in other regions.25
Additionally, it is worth noting that our definition of POMR evaluated mortality over the duration of the inpatient hospitalisation. Recent studies of POMR in Brazil have reported substantially lower mortality rates ranging from 0.16% to 0.51% in tertiary hospitals in São Paulo.26 ,27 These studies, however, have been single-centre studies with a follow-up period no >24 hours from procedure. The POMR we report is provided over a much longer duration of follow-up.
Worldwide, 33 million people each year face catastrophic expenditures due to surgical costs.1 ,28 SUS strives to mitigate this for Brazilians by eliminating user fees. The World Bank, however, estimates that 29.9% of public health expenses in Brazil are passed on to the patient as out-of-pocket expenditure.13 While studies have reported that much of this expenditure is on non-procedural costs such as medicines,29 ,30 it is most likely that the associated expenses of surgery exert a substantial burden on low-income families. Non-medical costs such as transportation, which were not accounted for in our study, can also amount to an enormous economic burden.31 Since SUS strives to truly achieve universally affordable surgical care, consideration of these out-of-pocket expenses and how they may vary by region is critical. Doing so will require an understanding of patient perspectives on healthcare financing.
This study has limitations. Notably, we were not able to calculate 2-hour access to a surgical facility since we could not accurately identify which hospitals are currently equipped with operating rooms, which hospitals have on-call anaesthesiologists, and which hospitals have physicians capable of performing caesarean section, management of open fractures and laparotomy. Owing to this, the proxy measure we report most likely overestimated the population's true 2-hour access to surgical care. Furthermore, our estimation assumes access to a motor vehicle, no road traffic and the presence of a functional operating room at the hospital. A true measurement of 2-hour geographic access would require facility-level analysis of hospital surgical capabilities, workforce availability with full-time equivalents and patient transportation methods. To carry this out on a population level, a sampling strategy would most likely need to be used and extrapolated. Further studies exploring this indicator are warranted. Moreover, this indicator could be buttressed by reporting operating theatre density/100 000.
An additional limitation of our data is the fidelity of our data sources. Reporting concerns have been raised about admission diagnoses in DATASUS, though this is a parameter we did not use in our analysis.11 In addition to variable mortality reporting, misreporting of employment is thought to be prevalent, as DATASUS collects data on job titles but not necessarily on actual specialist training. While we are able to estimate indicator 2 from these data, it is limited by the data set it is drawn from. Similarly, out-of-pocket spending on healthcare most likely differs by income level,29 which could lead to our reported numbers for indicators 5 and 6 underestimating the true value.
A final limitation of our study is its focus on the public sector. While SUS is available to all, there remains a complex private–public mix for healthcare provision.5 ,32 This public spending on healthcare accounts for 4.7% of GDP33 while private spending is thought to account for an additional 5.0% of GDP.34 Private insurance covers between 20% and 25% of the population21 and private facilities frequently care for SUS and private patients. Nevertheless, our findings apply to the system that cares for the vast majority of Brazilians.
Despite these limitations, this study uses a detailed and publicly available data set along with robust modelling techniques to provide a systematic analysis of Brazil's surgical system. We evaluate areas of surgical preparedness, care delivery and financial impact on patients. Our analysis is unique in its evaluation of surgical care at the state level and provides insight into regional variability.
From our assessment, we identify areas in which Brazil's surgical system can be improved while also gaining insight into these newly proposed surgical indicators. Some of the indicators were easily calculated and, in Brazil, further details such as disaggregation of the surgical workforce, evaluation of case-mix for surgical volume and an income-stratified approach to evaluating financial risk protection are warranted. Other indicators were difficult to collect. Notably, indicator 1 was challenging to determine even in a country with robust public healthcare data like Brazil. This may have implications for the ability to collect this indicator in other low-income and middle-income countries where existing data collection mechanisms are even more limited. These findings are summarised in table 3.
Recommendations for surgical system strengthening in Brazil and globally for the Lancet indicators
Conclusions
Brazil is a vast and populous country with a public surgical system that should be applauded for meeting several key benchmarks. Nevertheless, dissatisfaction with surgical care in Brazil remains high.9 Our analysis points to large geographic disparities which raise concerns of equity. Policies should focus on stimulating appropriate geographic allocation of the surgical workforce, addressing the deficits of certain specialists, and better distributing surgical volume. An integrated and in-depth consideration of these indicators will uncover various inequities in care provision that must be further investigated and addressed. This may involve patient-level and facility-level analyses to better understand key issues related to geographic and financial access to care or careful consideration of quality of care when other indicator benchmarks are met.
This study also demonstrates that the collection of surgical system indicators is possible where national health data are recorded and made available. This type of analysis can be encouraged for all nations seeking to understand their surgical systems.
References
Footnotes
BBM and SS are co-first authors.
NA and MGS are co-last authors.
Handling editor Valery Ridde.
Twitter Follow Benjamin Massenburg @bbmassenburg, Saurabh Saluja @newvernacular, Joshua Ng-Kamstra @joshngkamstra, John Meara @JohnMeara and Mark Shrime @markshrime
Contributors BBM and SS were involved in literature search, figures, study design, data collection, data analysis, data interpretation and writing. HEJ and JN-K were involved in literature search, data analysis, data interpretation and writing. NPR, AGAG and MCS were involved in literature search, data analysis and data interpretation. JGM, NA and MGS were involved in study design, data analysis, data interpretation and writing.
Funding MGS receives grant support from the GE Foundation Safe Surgery 2020 Project and from the Steven C. and Carmella Kletjian Foundation.
Competing interests None declared.
Provenance and peer review Not commissioned; externally peer reviewed.
Data sharing statement No additional data are available.