Article Text

Abstract
Background It is uncertain whether the inverse equity hypothesis—the idea that new health interventions are initially primarily accessed by the rich, but that inequalities narrow with diffusion to the poor—holds true for cancer screening in low and middle income countries (LMICs).This study examines the relationship between overall coverage and economic inequalities in coverage of cancer screening in four middle-income countries.
Methods Secondary analyses of cross-sectional data from the WHO study on Global Ageing and Adult Health in China, Mexico, Russia and South Africa (2007–2010). Three regression-based methods were used to measure economic inequalities: (1) Adjusted OR; (2) Relative Index of Inequality (RII); and (3) Slope Index of Inequality.
Results Coverage for breast cancer screening was 10.5% in South Africa, 19.3% in China, 33.8% in Russia and 43% in Mexico, and coverage for cervical cancer screening was 24% in South Africa, 27.2% in China, 63.7% in Mexico and 81.5% in Russia. Economic inequalities in screening participation were substantially lower or non-existent in countries with higher aggregate coverage, for both breast cancer screening (RII: 14.57 in South Africa, 4.90 in China, 2.01 in Mexico, 1.04 in Russia) and cervical cancer screening (RII: 3.60 in China, 2.47 in South Africa, 1.39 in Mexico, 1.12 in Russia).
Conclusions Economic inequalities in breast and cervical cancer screening are low in LMICs with high screening coverage. These findings are consistent with the inverse equity hypothesis and indicate that high levels of equity in cancer screening are feasible even in countries with high income inequality.
- ACCESS TO HLTH CARE
- AGEING
- CANCER: BREAST
- CANCER: CERVIX
- Health inequalities
Statistics from Altmetric.com
Introduction
Cancer is a major public health concern worldwide, with breast and cervical cancers being the leading causes of death in women. According to recent statistics, half of the new breast cancer cases and more than 85% of the global cancer burden occurred in the less developed regions of the world.1 The incidence of these cancers is expected to increase rapidly in low and middle income countries (LMICs) due to lower infection disease risks leading to ageing populations and increased exposure to cancer risk factors.2–4 While deaths from breast and cervical cancer may be declining in high-income countries, mortality rates remain high in LMICs as cases are often diagnosed late and treatment remains limited.4–6 Despite compelling evidence of effectiveness in reducing mortality,7–9 cancer screening coverage is generally low in LMICs with large inequalities between socioeconomic groups.4 ,10 ,11 A persistent question has been whether it is possible to achieve equity in cancer screening despite high levels of income inequality in developing countries.
The ‘inverse equity hypothesis’ suggests that new health interventions will initially benefit higher socioeconomic groups and widen health inequities, but if coverage increases overtime, the poor can eventually catch up and health inequities can be narrowed.12 ,13 The hypothesis has important policy implications, as it suggests that countries with high levels of internal income inequality can still achieve health equity. However, empirical evidence to support the hypothesis is largely drawn from child health studies conducted in Brazil; the theory remains largely untested in the area of non-communicable diseases (NCDs),12 ,14–16 and is particularly important in the context of rising NCD rates that some groups have viewed as presenting an insurmountable challenge to middle-income country health systems.17 ,18 The extent to which country-specific policies promote or constrain diffusion of interventions from the rich to the poor requires further investigation. For example, recent health reforms in China and Mexico have led to lower user charges for women's cancer screening.19
The aim of this study is to assess the relationship between overall cancer screening coverage and socioeconomic inequalities in coverage in four middle-income countries. We hypothesise that inequalities in cancer screening will be narrower in those countries with a higher aggregate screening coverage.
Methods
Data and study sample
Data for this study came from the WHO Study on Global Ageing and Adult Health (SAGE, wave 1). This study collected data on six middle-income countries: China, Ghana, India, Mexico, Russia and South Africa during 2007–2010. The focus of the survey is on individuals over the age of 50 years, although it also includes a smaller number of participants aged between 18 and 49 years. The SAGE study employed a clustered household sampling strategy designed to obtain nationally representative samples from each country. Household and individual level analyses weights, which included sample selection and a post-stratification factor, were provided for each country. The purpose of SAGE is to obtain consistent data on health status, risk factors and healthcare utilisation of adult populations (including preventive services) across middle-income countries, permitting cross-country comparisons of key health indicators.20 ,21 A detailed description of the survey objectives and methods can be found elsewhere.22 ,23
The sample size of women in SAGE is 8016 in China, 2749 in Ghana, 7489 in India, 2742 in Mexico, 2802 in Russia and 2428 in South Africa. For the purpose of the study, we analysed data on women aged 50–74 years for breast cancer screening, and on those aged 25–69 years for cervical cancer screening, as these age ranges commonly confer programme eligibility in line with national and international guidance.5 ,24 Data from India and Ghana were excluded from our study as cancer screening coverage overall was too low (<1% in India and <4% in Ghana) to provide meaningful analyses of inequalities across economic groups.
Variables
To assess coverage of cancer screening, respondents were asked “When was the last time you had a mammography? (That is, an X-ray of your breasts taken to detect breast cancer at an early stage.)” and “When was the last time you had a pelvic examination? Respondents who answered positively on having a pelvic examination were further asked “The last time you had a pelvic examination, did you have a Pap smear test?” Following clinical guidelines that are more appropriate for LMICs settings, coverage of breast cancer screening was defined as the percentage of the eligible population (women 50–74 years) having had a mammography in the past 3 years at the point of interview, and coverage of cervical cancer screening was defined as the percentage of the eligible population (women 25–69 years) having had a pelvic examination with a Pap smear in the past 3 years at the point of interview.5
Household wealth (in quintiles) was used as the indicator of economic position. This variable was provided in the original SAGE data set having been derived from a list of household assets (such as television, cooking stove, etc).25 Covariates in the analyses include respondents’ age, area of residence (urban, rural), education attainment (primary or less, secondary, tertiary or more), marital status (single/separated/widowed, married/cohabiting) and insurance (no insurance, mandatory, voluntary, both). We also adjusted for some country-specific variables which include respondents’ ethnicity (African–American/Caucasian/coloured, mixed ancestry/others) in South Africa, and geographic location (provinces) in China and South Africa. Online supplementary appendix table 1 provides more detail on the variables used in this study.
Statistical analyses
We used three regression-based methods to measure the magnitudes of economic inequalities: (1) Adjusted OR (AOR) of screening between the lowest and higher economic groups, (2) Relative Index of Inequality (RII) and (3) Slope Index of Inequality (SII).26 ,27
We ran country-level multiple logistic models to estimate the relationship between economic status and screening coverage by presenting AOR between the lowest (the reference group) and the highest wealth quintiles, adjusted for all the covariates mentioned above. In addition, we calculated the SII and RII to provide a summary measure of health inequality. SII measures the absolute level of inequality while RII measures the relative inequality, assuming a linear association between the outcome indicator and ranked groups.26 An advantage of the SII and RII measures are that they account for inequalities across the entire economic gradient instead of only comparing the OR between the most and least affluent individuals as shown from the logistic models.26–28
We used a ‘modified Poisson’ approach, as suggested by Zou29 to compute SII and RII, which provides more robust estimates as compared to using a binary approach. Wealth level is transformed into a summary measure that is scaled from zero (the lowest wealth group) to one (the highest wealth group) and is weighted to reflect the share of the sample at each individual wealth level. Ridit scores were assigned values (between 0 and 1) of the cumulative percentage of the midpoint of their ranges. A positive SII and an RII that is larger than 1 indicate that the wealthy are more likely to go for screening as compared to the poor. We adjusted for age in the calculation of both RII and SII, and present the 95% CI.
Overall, 6.6% and 6.7% of the respondents were excluded from this study for breast and cervical cancer screening, respectively, due to missing values in outcome and independent variables. The multicollinearity diagnostics variance inflation factor (VIF) were all less than 5, indicating that the assumption of reasonable independence among predictor variables was met. Sampling weights were used to account for the complex, multistage design of the SAGE survey,20 and Stata V.13 (Statacorp) was used to perform all statistical analyses.
Results
Sample characteristics
The characteristics of our study sample are reported in online supplementary appendix table 2. The country sample sizes for breast cancer screening are: China (5735), Russia (1871), South Africa (1541), Mexico (991), and those for cervical cancer screening are: China (5823), Russia (1702), South Africa (1468), Mexico (1080). The majority of the respondents were educated to the primary school level or below (except for Russia), were married or cohabiting (except for South Africa) and were living in an urban setting, except for China where about a similar proportion lived in urban and rural settings. Coverage of breast cancer screening ranged from 10.5% to 43% (10.5% in South Africa, 19.3% in China, 33.8% in Russia and 43% in Mexico), and coverage of cervical cancer screening varied from 24.0% to 81.5% (24% in South Africa, 27.2% in China, 63.7% in Mexico and 81.5% in Russia; figure 1).
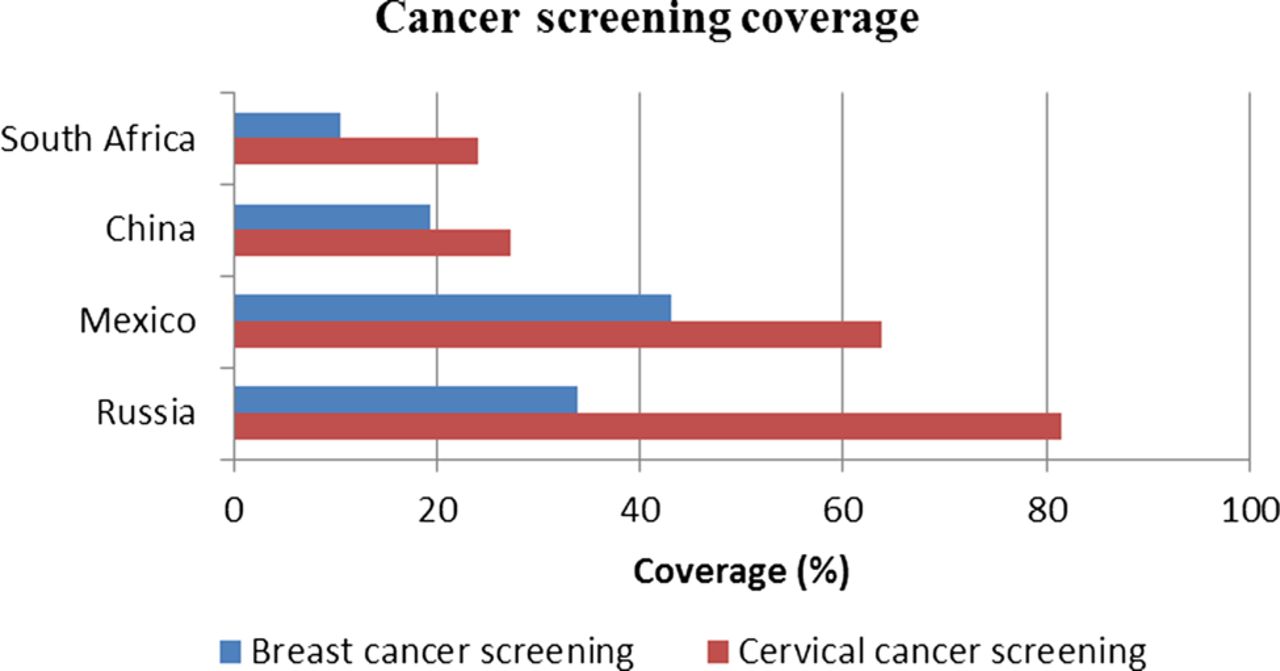
Coverage of Breast and Cervical Cancer Screening in middle-income countries. Data from the WHO Study on Global Ageing and Adult Health (SAGE), 2007–2010.
Coverage by economic status—AOR
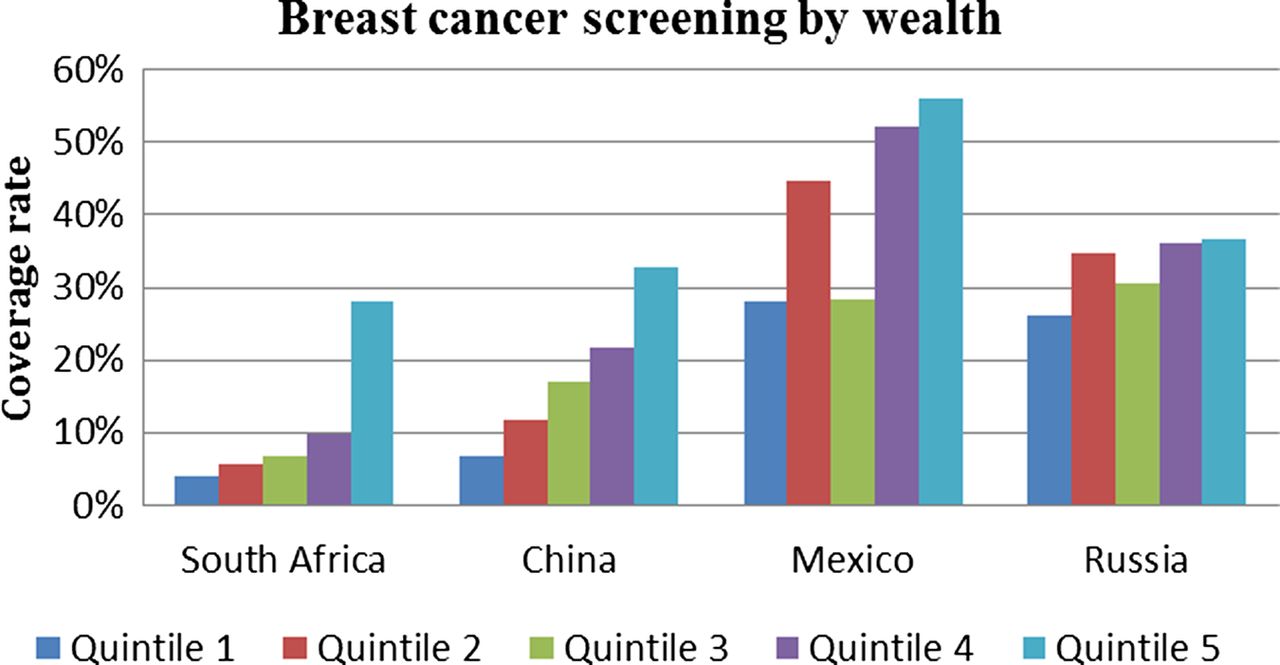
Figure 2 presents the breast and cervical cancer screening coverage rates by wealth quintiles. In general, coverage of breast and cervical cancer screening increased with increasing household wealth. Economic inequalities in coverage are steeper in China and South Africa, where overall coverage is low, than in Mexico and Russia, where overall coverage is higher.

Coverage of Breast and Cervical Screening by Wealth Quintile. Quintile 1 is the poorest, and quintile 5 is the most affluent. Data from the WHO Study on Global Ageing and Adult Health (SAGE), 2007–2010.
We present results for regression analyses in tables 1 and 2. In South Africa, the uptake for breast cancer screening was higher for those in the highest wealth group compared with those in the lowest wealth group; however, the regression coefficient was not statistically significant (28.1% vs 4.0%; AOR=1.92, 95% CI 0.66 to 5.72). The same pattern is also found in cervical cancer screening (35.1% vs 5.6%; AOR=1.29, 95% CI 0.22 to 7.43). Respondents residing in urban areas are more likely to have breast cancer screening than those residing in the rural areas (AOR=2.63, 95% CI 1.12 to 6.21). Respondents who are single (including widowed, separated) are also less likely to have cervical cancer screening than those who are married or cohabiting (AOR=0.34, 95% CI 0.14 to 0.81).
Inequality in coverage of breast cancer screening (Adjusted OR)
Inequalities in coverage of cervical cancer screening (Adjusted OR)
In China, women in the highest wealth quintile had a 2.37 fold (95% CI 1.42 to 3.95) higher probability of having breast cancer screening and a 3.39-fold (95% CI 1.66 to 6.92) higher probability of having cervical cancer screening than those in the lowest wealth quintile (tables 1 and 2). Respondents residing in urban areas are more likely to receive cancer screening than those in rural areas (AOR=2.31, 95% CI 1.61 to 3.31 for breast cancer screening; AOR=1.98, 95% CI 1.16 to 3.39 for cervical cancer screening). In addition, respondents with the highest education have higher uptake rates than those with the lowest education (AOR=2.54, 95% CI 1.13 to 5.70 for breast cancer screening; AOR=2.54, 95% CI 1.34 to 4.80 for cervical cancer screening).
In Mexico, coverage of breast cancer screening was higher for those in the highest wealth group compared with those in the lowest wealth group (56.1% vs 28.2%; AOR=2.02, 95% CI 0.83 to 4.93). The same pattern is also found in cervical cancer screening (74.8% vs 50.7%; AOR=2.69, 95% CI 0.98 to 7.39). Respondents who are single (including widowed, separated) were less likely to have breast/cervical cancer screening than those who are married or cohabiting (AOR=0.38, 95% CI 0.17 to 0.81 for breast cancer screening; AOR=0.44, 95% CI 0.21 to 0.92 for cervical cancer screening).
In Russia, coverage of breast cancer screening was higher for those in the highest wealth group compared with those in the lowest wealth group (36.5% vs 26.1%; AOR=1.01, 95% CI 0.47 to 2.16). However, the economic inequalities are smaller for cervical cancer screening (85.1% vs 75.6%; AOR=1.32, 95% CI 0.59 to 2.94). Uptake for breast cancer screening is lower for those not married or cohabiting (AOR=0.63, 95% CI 0.44 to 0.91).
Coverage by economic status—RII and SII
Although most estimates had large CIs resulting in a number of the inequality estimates not being statistically significant, the RII for breast cancer screening was highest for South Africa at 14.57 (3.04 to 69.85) and lowest for Russia at 1.04 (0.61 to 1.78; tables 3). The SII for breast cancer screening was highest in Mexico and China and lowest in Russia at 4.60 (−12.32 to 21.53). The RII for cervical cancer screening was highest in China at 3.60 (2.09 to 6.21) and lowest in Russia at 1.12 (0.94 to 1.35; table 3). The SII for cervical cancer screening was highest in China at 30.63 (17.67 to 43.59) and lowest in Russia at 10.95 (−3.78 to 25.67).
Inequalities in coverage of breast and cervical cancer screening (Relative Index of Inequality and Slope Index of Inequality)
Economic inequality and overall coverage
The relationship between overall coverage and inequalities in coverage as measured by the RII is presented in figure 3. China and South Africa have low overall screening coverage and higher inequalities while Russia and Mexico have higher screening coverage and markedly lower inequalities.

Relationship between overall Screening Coverage and Relative Inequality.
Discussion
Using nationally representative data from the WHO SAGE, this study examined economic inequalities in coverage of breast and cervical cancer screening in South Africa, China, Mexico and Russia. Coverage for breast cancer screening ranged from 10.5% to 43.0%, and for cervical cancer screening it ranged from 24.0% to 81.5%. There were inequalities in coverage within all four countries, with fewer women from the lower wealth quintiles reporting screening participation. Our findings are consistent with previous research showing the low coverage of breast and cervical cancer screening overall in LMICs.5 ,11 However, we also found that inequalities are substantially lower or non-existent in LMICs in countries with higher aggregate levels of coverage. These findings provide some support for the inverse equity hypothesis, as we identified marked inequalities—with higher coverage in the highest wealth quintile—in South Africa and China where aggregate coverage is low, and saw evidence of lower inequalities in Mexico and especially in Russia where coverage of cancer screening is approaching levels achieved in some high-income settings.
These findings contribute substantial new knowledge to the field of study of health inequalities. While a small number of studies have documented socioeconomic inequalities in cancer screening coverage in LMICs,5 ,30 little is known about how inequalities in coverage vary at different stages of programme development and the extent to which these are attenuated as population reach of screening programmes increases. Our findings are consistent with findings from high-income countries, which demonstrate that inequalities in cancer screening coverage can be attenuated as programme reach increases.31
Our study has a number of strengths and limitations. The main strength of this study is the use of a consistent and large nationally representative survey of older adults in multiple middle-income countries, which allows for comparison of cancer screening coverage and economic inequalities across countries. We looked at different dimensions of economic inequalities using three regression-based methods which are increasingly used in the literature.27 ,30 However, this study has several important limitations which include the use of self-reported participation in cancer screening in the past 3 years, which is vulnerable to recall bias.32 Participants might forget the timing of their screening or may not recall whether cervical screening was performed with a pelvic examination.11 Our analyses used cross-sectional data which did not permit examination of how inequalities in screening participation varied with overall coverage overtime. We only had comparable data for four countries; therefore, caution should be tan in generalising our results to all LMICs. The sample size was small in Mexico and South Africa in particular, which meant that some of our results lacked precision. Household wealth was used as an indicator of socioeconomic position instead of education as this was more equally distributed across each population. For example, the majority of respondents in South Africa have education attainment of primary and below (75% of our sample in breast cancer screening), whereas this was less than 6% in Russia.
The impact of screening on morbidity and mortality from cancer is highly dependent on the quality of the screening programme, including the call/recall function, follow-up of positive results and access to high quality diagnostic and treatment services. We had no information on the nature of quality assurance arrangements of the screening provided or access to follow-up services, and whether this varied between socioeconomic groups, in the countries studied. Furthermore, we did not have information on the potential barriers to screening participation, such as privacy in clinics, travel distances to clinics or associated out-of-pocket costs.
Our research should prompt further investigations into the mechanisms to improve cancer screening accessibility. We observed discernible economic inequalities in breast and cervical cancer screening in four LMICs, with magnitudes substantially lower in Mexico and Russia where there was higher aggregate coverage. Whether the near absence of inequality seen is due to concerted efforts to increase participation in low SES groups, universal policies to increase coverage overall or no concerted policy action in this area is an important question. An examination of country level policies on breast and cervical screening may therefore be insightful. The low coverage rates and evident economic inequalities in screening participation in China highlight the need for improvements to achieve better health outcomes. As the basic social insurance programme in China does not always cover breast and cervical cancer screening, there is a need for further lowering of patient cost sharing or provision of payment exemptions for certain groups.19 In South Africa, a national cervical cancer screening was introduced in the year 2000, which allows women to have three free Pap smears in their lifetime at 10-year intervals.
However, there are still many barriers to screening in the public sector health service, while Caucasian women, with greater access to private sector services, generally have regular Pap smears.33 ,34 Learning from previous efforts is crucial as Project Screen Soweto has proven to be a failed attempt to establish a cytology-based screening programme in South Africa in 1980. It was launched with limited prior public health education due to concerns about health service difficulties in coping with a sudden surge of demand.33 Mexico started a comprehensive health system reform since the year 2000. The establishment of a healthcare insurance component, the Seguro Popular, lowered patient cost sharing, especially in those without health insurance before the reform.35 Therefore, the smaller inequalities observed in Mexico could be due to the universal health insurance which provided free breast and cervical cancer screenings for all women.36 In Russia, in the absence of a national screening programme, opportunistic screening provided at the primary care level through periodic health checks is common with the expectation that large sections of the population will attend.37 Although there are no user charges for access of public sector health services under the health insurance coverage, patients may still have to pay for semiformal user charges and informal payments.38 ,39 To improve coverage, cervical cancer screening was included in a recent pay-for-performance programme for GP in the Chuvash Republic.37 In summary, few countries in our study appear to have specific policies in place to increase cancer screening coverage in women from low-income groups, and universal policies, such as the presence of an organised screening programme provided through accessible services with low copayment levels, may be sufficient to achieve equitable coverage.40 ,41
Support for this assertion is provided by a study by Baker and Middleton,31 which suggests that inequalities in the coverage of cervical cancer screening in England narrowed gradually throughout the 1990s after the introduction of a formal national programme in 1988 and the implementation of a new contract for general practitioners in 1990.31 The latter provided general practices with generous financial incentives to achieve 50% and 80% coverage of their eligible practice population and resulted in a major expansion in the number and workload of practice nurses. This study suggests that the increase in practice nurses, which occurred disproportionately in deprived areas, may have contributed to the narrowing in inequalities in the coverage seen.
Future research should include subsequent waves of the SAGE survey to analyse the changes in screening inequalities overtime to continue to test the inverse equity hypothesis. Earlier World Health Survey (WHS) data have too small sample sizes for the older population to draw meaningful comparisons; hence, studies of middle-income countries will need to rely on the SAGE follow-up studies underway currently.22
Economic inequalities in breast and cervical cancer screening are substantially lower or non-existent in LMIC countries with higher screening coverage increases in LMIC settings. These findings are consistent with the inverse equity hypothesis and highlight the fact that accelerating equity in cancer screening programmes is feasible even in LMICs with high levels of income inequality.
What is already known on this subject?
-
Cancer screening coverage is generally low in developing countries with large inequalities between socioeconomic groups. Few studies have examined whether the inverse equity hypothesis—the idea suggesting that new health interventions are initially primarily accessed by the rich, but that inequalities narrow with diffusion to the poor—holds true in breast and cervical cancer screening in low and middle income country (LMIC) settings.
What this study adds?
-
There were inequalities in coverage within all four low and middle-income countries (LMICs) studied, with fewer women from the lower wealth quintiles reporting screening participation. Inequalities were substantially lower in countries with higher aggregate levels of coverage, which is consistent with the inverse equity hypothesis. Our results also indicate that high levels of equity in cancer screening are feasible even in countries with high income inequality.
Acknowledgments
This article uses data from the WHO Study on Global Ageing and Adult Health (SAGE) Wave 1 V.1.1.0. SAGE is supported by the USA National Institute on Aging's Division of Behavioral and Social Research and the WHO’s Department of Health Statistics and Information Systems.
References
Supplementary materials
Supplementary Data
This web only file has been produced by the BMJ Publishing Group from an electronic file supplied by the author(s) and has not been edited for content.
Files in this Data Supplement:
- Data supplement 1 - Online supplement
Footnotes
-
Contributors JTL and CM conceived the article. ZH and JTL conducted the statistical analyses. ZH, JTL, CM and SB wrote the paper.
-
Competing interests CM is funded by the Higher Education Funding Council for England and the National Institute for Health Research Collaboration for Leadership in Applied Health Research and Care scheme. The Department of Primary Care & Public Health at Imperial College is grateful for the support from the National Institute for Health Research Biomedical Research Centre Funding scheme, the National Institute for Health Research Collaboration for Leadership in Applied Health Research and Care scheme, and the Imperial Centre for Patient Safety and Service Quality.
-
Competing interests None.
-
Ethics approval The SAGE study received human subjects testing and ethics council approval from research review boards local to each participating site, and from the WHO Ethical Review Committee. Informed consent was obtained from each respondent before interview and examination.
-
Provenance and peer review Not commissioned; externally peer reviewed.