


Abstract
Many sub-Saharan African countries have achieved substantial gains in insecticide treated bednet coverage since 2005. The Tanzania National Malaria Control Programme identified school-based net distribution as one potential ‘keep-up’ strategy for the purpose of maintaining long-lasting insecticidal net (LLIN) coverage after a nationwide mass campaign in 2011. The School Net Programme (SNP) was implemented in three regions of southern Tanzania and distributed one LLIN to each enrolled child attending schools in primary grades (standards) 1, 3, 5 and 7, and secondary grades (forms) 2 and 4 in 2013 and again with slightly modified eligibility criteria in 2014 and 2015. Household surveys in the programme area as well as in a control area were conducted after each of the SNP distributions to measure ownership and use of long-lasting insecticide treated nets. Ownership of at least one LLIN after the first distribution was 76.1% (95% CI 70.8–80.7) in the intervention area and 78.6% (95% CI 74.4–82.3) in the control area. After the second distribution, ownership of at least one LLIN had dropped significantly in the control area to 65.4% (95% CI 59.5–71.0) in 2015 (P < 0.001), while coverage in the intervention area was maintained at 79.3% (95% CI 75.4 × 82.6). Ownership of at least one LLIN in intervention area remained stable following the second round of net distribution. During the same period LLIN ownership, especially of enough nets to ensure all household member access, fell significantly in the control area. These results demonstrate that the SNP may be sufficient to maintain stable LLIN coverage following a mass distribution of LLINs.
Key Messages
School-based distribution may be sufficient to maintain stable LLIN coverage following a mass distribution of LLINs.
Despite inter and intra household reallocation of LLINs, school-based interventions mainly reach households with school-age, school-enrolled children, other intervention channels may be needed to reach households without these key populations.
Introduction
Many sub-Saharan African countries have achieved substantial gains in insecticide-treated bednet coverage since 2005 (Bhatt et al. 2015). Tanzania has been at the forefront of this process, especially in developing and implementing large scale, innovative delivery strategies (Schellenberg et al. 2001; Hanson et al. 2007, 2009; Skarbinski et al. 2007; Mulligan et al. 2008; Yukich et al. 2008; Bonner et al. 2011; West et al. 2012; Renggli et al. 2013; Eze et al. 2014). To date, insecticide-treated nets and long-lasting insecticidal nets (LLIN) in Tanzania have been delivered through traditional social marketing methods, discount vouchers (Tanzania National Voucher Scheme), mass distribution campaigns targeting children (Under-5 Catch-up Campaign [U5CC]) and mass universal coverage campaigns (2010/11 Universal Coverage Campaign [UCC]; 2015/16 UCC), all alongside a longstanding private commercial market for mostly untreated nets (Kikumbih et al. 2005; Killeen et al. 2007; Njau et al. 2009; Gingrich et al. 2011). Because solely market-based approaches to LLIN delivery have typically failed to achieve universal coverage targets and mass distributions alone have not provided sustainable achievement of these targets, the Tanzania National Malaria Control Programme (NMCP) has sought to develop alternative delivery methods (Grabowsky et al. 2007; Koenker et al. 2013; Eze et al. 2014). For the purpose of maintaining LLIN coverage gains achieved through universal distribution and the Tanzania National Voucher Scheme (TNVS), the NMCP identified school-based net distribution as one potential ‘keep-up’ strategy (Koenker et al. 2013), in combination with targeted distribution to pregnant women and infants through Reproductive and Child Health clinics. Prior to the initiation of the School Net Programme (SNP), the NMCP had implemented a strategy consisting of the TNVS, and nationwide mass distributions, most recently one focused on achieving universal coverage (UCC). These mass distributions succeeded in achieving high LLIN coverage in terms of both ownership and use (West et al. 2012; Renggli et al. 2013; TACAIDS 2013).
In order to test both the feasibility and potential of the annual school-based LLIN distribution, the NMCP developed the SNP which was designed to deliver LLINs through primary and secondary schools in the three regions in southern Tanzania. This approach was designed to supplement the ongoing TNVS and to maintain coverage gains achieved after the UCC. The programme has now completed three rounds of distribution though only the first two are considered in this article.
Although schools have been used as focal points for health communication and promotion activities widely and have been utilized in numerous other preventative and nutritional interventions, to our knowledge the SNP in Tanzania is the first large-scale school-based LLIN distribution programme to be rigorously evaluated in sub-Saharan Africa. As such, potential lessons learned from this programme will be helpful for both policy decisions related to the programme in Tanzania but also to other locations in Africa which might seek to employ schools in the maintenance of sustainable LLIN coverage.
The SNP was piloted in 2013 in the Southern zone (Lindi, Mtwara, and Ruvuma regions) by the Ministry of Health and Social Welfare in partnership with the Ministry of Education and Vocational Training (MoEVT), with funds from President’s Malaria Initiative (PMI) and the Swiss Agency for Development and Cooperation. Two additional annual rounds of issuing LLINs within the SNP were implemented in the Southern zone in 2014 and 2015 to contribute to the aim of maintaining universal coverage of LLINs in that area. These rounds were funded through the US Agency for International Development, the PMI and implemented by a consortium of partners (including: RTI International, Tanzania Red Cross Society, PSI, JHU/COMMIT) led by the NMCP with support from the Swiss Tropical and Public Health Institute.
This article describes an evaluation of the SNP programme in terms of eligibility, outcomes and programme effectiveness related to LLIN distribution, coverage and use. LLINs have been shown to provide significant protection against malaria infection, as well as malaria related morbidity and mortality both in controlled trial settings (Hawley et al. 2003; Lindblade et al. 2004) as well as in numerous observational studies of routine field implementation (Lim et al. 2011; Larsen et al. 2014; Eisele et al. 2005, 2010, 2011,2012a,b). As such the ultimate health-related outcomes were not directly measured.
Materials and methods
Study setting
The SNP was implemented in three regions of southern Tanzania—Ruvuma, Lindi, and Mtwara (Figure 1). These three regions are subject to intense perennial transmission of malaria and home to a total population of ∼3.5 Million. The evaluation of the SNP took place in the above-mentioned Southern zone regions as well two control districts, Chato and Sengerema, in the Lake zone of northern Tanzania. The two control districts were selected because the geographic distance between them and the intervention areas greatly minimized the chance of any contamination of the programme into control areas and because they had both passed similar periods of time with no mass net distribution. Household size was larger in the control areas than in the intervention areas. Primary school enrollment rates were slightly higher in the intervention areas and the intervention area had a higher proportion of households with nets purchased at full cost from retailers. Additionally, Indoor Residual Spraying was used as an additional malaria control strategy in the control areas but not in the intervention areas.
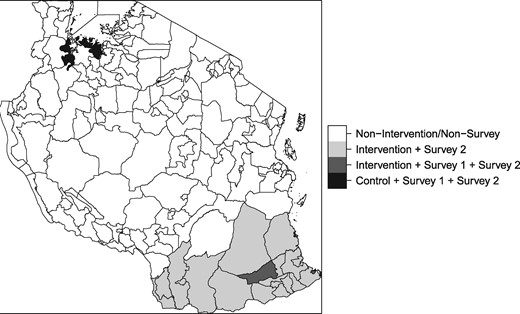
Map of Tanzania, highlighting intervention and study areas
The school-based net distribution programme
During its first year, the SNP distributed one LLIN to each enrolled child attending schools in standards (primary school grades) 1, 3, 5 and 7, and forms (secondary school grades) 2 and 4. In the second year, two additional classes, standards 2 and 4, in the Lindi region were added. Additionally, all teachers of eligible classes were added to the second and third distributions. At the time of writing, the SNP had completed a third annual round of distribution, though this article considers only the first two. The first SNP distribution occurred in July of 2013, and involved the distribution of ∼450 000 LLINs to pupils in eligible classes in over 2600 schools. The second SNP distribution occurred during August of 2014 during which ∼489 000 nets were distributed to ∼465 000 pupils and 24 000 teachers. See Figure 2 for a history of net distribution in both study areas.
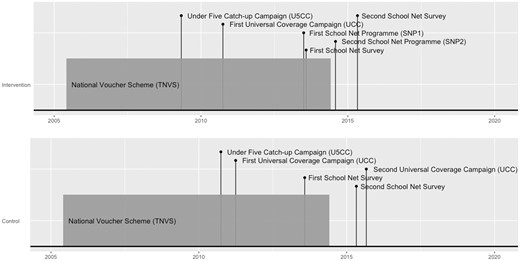
Timeline of SNP and other past LLIN interventions in intervention and control areas
The Tanzanian school system
The SNP was implemented in collaboration with the MoEVT which manages and operates publicly funded schools in Tanzania. Primary school in Tanzania is free and enrollment is compulsory for every child who has reached the age of 7. Primary education lasts for 7 years at which time children who have merited a primary school certificate may enroll in lower public secondary education. Secondary education in Tanzania required from each student an annual fee of about 10 USD per year. In 2010, the primary school age population in Tanzania was estimated to be approximately 8 million with a net enrollment rate of 95.4 (Education Sector Development Committee 2010). In the same year, the lower secondary school age population in Tanzania was ∼3.3 million with a net enrollment rate of 30.8%. In the Southern Zone of Tanzania, at the time of the SNP-2 distribution there were 1,919 primary and secondary schools under MoEVT management.
Study design
Repeated cross-sectional two-stage cluster household surveys were conducted after each of the first and second SNP distributions to measure ownership and use of long-lasting insecticide treated nets. The surveys included an embedded cluster level panel in four evaluation districts (two intervention districts in Southern Zone and two control districts in the Lake Zone, which did not receive SNP distribution) in which the same survey clusters were visited in both SNP surveys, but households were newly randomly selected each survey round. A structured questionnaire based on standardized Malaria Indicator Survey (MIS) instruments was used as a survey tool to gather data through verbal interviews and direct observation.
Sampling and sample size
The first survey round occurred in August 2013. It was conducted in two implementing districts, Nachingwea and Mtwara Urban, in the Southern zone, selected for evaluation and two non-implementing districts, Chato and Sengerema, in the Lake zone of Tanzania selected to serve as control areas. The evaluation of the second round of SNP occurred between April and May of 2015 and included all districts from the first evaluation, but expanded its sampling frame in the Southern zone to include the remainder of the implementing regions (i.e. all of Ruvuma, Lindi and Mtwara). The first round included ten clusters within each of the four evaluation districts while the second survey round included all 40 clusters in the original round, an additional five clusters per evaluation district, and a sample from each of the three southern regions where the SNP was implemented to produce a regionally representative sample.
The general sampling scheme proceeded as follows: First, a number of wards were selected with probability proportional to size from each of the survey domains. Second, one sub-village was selected at random from each of the selected wards using simple random sampling. Third, a number of households within each sub-village were selected in a modified EPI-type sampling procedure: Starting from the centre of the sub-village, survey teams picked a random direction, identified all households along this transect to the edge of the sub-village, and took a systematic sample of these households.
The first survey sampled from four domains (Southern Zone: Nachingwea District and Mtwara Urban District; Lake zone: Chato District and Sengerema District), with 10 wards selected per domain, and 30 households selected per sub-village. Each of the wards sampled from in the first survey were purposefully included as part of the second survey. The second survey sampled from seven domains (Southern Zone: Nachingwea District, Mtwara Urban District, Ruvuma Region, Lindi Region, and Mtwara Region; Lake zone: Chato District and Sengerema District), with 15 wards selected per domain, and 20 households selected per sub-village.
Sample size for the second survey was calculated to detect a drop in ownership of at least one LLIN from 50 to 40% with 80% power and a Type-I error rate of 5%, assuming a design effect of 2.
Informed consent and ethical review
Written informed consent was obtained from survey respondents for all selected households. The study was reviewed by the Institutional Review Board of Tulane University, and the ethical review boards of the Ifakara Health Institute and the National Institute for Medical Research of the United Republic of Tanzania and Zanzibar.
Definitions and calculated variables
A LLIN was defined as any net received through either the TNVS, UCC, SNP or purchased nets of the brands Olyset, Netprotect, Permanet, Duranet, Interceptor or Icon Life. The following variables were all determined via self-report of the interviewee: pregnancy status, age, school enrollment, net source, whether or not a SNP net was brought home, whether or not a SNP net was given away by the household, whether or not a household member slept under a net the previous night, household asset ownership, and housing conditions.
Ownership, use and access outcomes were calculated as per the MIS Guidelines (Measure DHS 2012). All indicators were calculated for the de-facto household population. Access to an LLIN was defined as the percentage of the de-facto household population who could sleep under an ITN if each ITN in the household were used by up to two people. Wealth quintiles were calculated by running principal component analysis on a collection of household asset ownership and housing condition indicators and taking quintiles of the first principal component.
Statistical analysis
The ‘survey’ package for R software was used to calculate summary statistics and their design-adjusted standard errors using sampling weights calculated from the sample frame and recent national census data (Lumley 2014; Tanzania National Bureau of StatisticsTanzania Ministry of Finance 2014; R Core Team 2015). Design-adjustment was accomplished by specifying household-level probability weights with clustering at the ward level and stratification at the domain level. Differences between zones and years were assessed using design-adjusted Χ2-tests, t-tests and rank-sum tests. Throughout this manuscript, statistical significance is determined using α= 0.05.
Differences between zones in change over time in LLIN ownership and access were assessed using a survey-adjusted logistic regression model implemented with the ‘survey’ package for R software. Fixed effects were SNP year, study area, and the interaction of these two terms, making the analysis a ‘difference-in-differences’ analysis. This analysis was conducted on both all available data as well as only within repeated districts (nested panel data). As there were no appreciable differences in results between these analyses, only results from analyses using all available data are given in this article.
To assess what factors might contribute to a successful SNP, a number of household- and ward-level characteristics were tested for association with household possession of at least one net from the SNP. Factors found to be significantly associated with net ownership in bivariate tests were added as covariates to a multivariate mixed-effects logistic regression with random intercepts for each ward and a fixed effect for evaluation year. These analyses used only the intervention area data.
Results
Study sample
Over the course of two survey rounds, data was gathered on 17 572 people in 3367 households. Table 1 summarizes household and population characteristics by study zone and by year. The intervention area had significantly smaller household sizes, 4.1 (95% CI 3.9–4.3) compared with 5.9 (95% CI 5.4–6.5) in the control area (P < 0.001) in 2013. The average age in 2013 of surveyed residents in the intervention area was significantly higher than that in the control area. School enrollment in 2013 amongst ages 7–13 differed significantly between study area, 86.3% (95% CI 82.9–89.2) in the intervention area and 74.3% (95% CI 65.5–81.5) in the control area (P = 0.004) and fell significantly in both areas between 2013 and 2015 (Intervention P = 0.002; Control P = 0.050). School enrollment in 2013 amongst ages 14–17 was lower at 61.3% (95% CI 45.0–75.5) in the intervention area and 68.1% (95% CI 60.6–74.8) in the control area. Heads of households in the intervention area had 1.5 more years of education in 2013 than those in the control area (P = 0.001).
Socio-demographic characteristics of sample and their sampling-adjusted 95% CIs
| Intervention Zone | Control Zone | |||
|---|---|---|---|---|
| 2013 | 2015 | 2013 | 2015 | |
| Number surveyed households | 593 | 1548 | 596 | 630 |
| Number people in households | 2415 | 6822 | 4075 | 4206 |
| Number of nets in households | 1463 | 3408 | 1295 | 1092 |
| Number of SNP nets in households from either round of SNP | 228 | 1179 | Not Applicable | |
| Mean household size* | 4.1 (3.9–4.3) | 4.1 (4.0–4.3) | 5.9 (5.4–6.5) | 5.7 (5.1–6.2) |
| Female (%) * | 54.1 (52.3–55.8) | 52.8 (50.9–54.7) | 50.5 (48.7–52.3) | 51.7 (50.1–53.4) |
| Pregnant (% of female) | 7.6 (5.1–11.2) | 7.0 (4.7–10.2) | 8.9 (6.7–11.8) | 11.4 (7.3–17.5) |
| Households with electricity (%) | 23.6 (12.7–39.6) | 35.8 (26.5–46.4) | 15.0 (6.3–31.6) | 10.4 (4.7–21.8) |
| Primary school age (% total number people aged 7–13) * | 18.7 (17.0–20.5) | 18.6 (16.4–21.1) | 23.5 (21.9–25.1) | 20.7 (17.8–24.0) |
| Secondary school age (% total number people aged 14–17) | 8.8 (7.7–10.1) | 9.3 (8.4–10.3) | 8.8 (7.8–9.9) | 9.0 (7.9–10.3) |
| Age 0–4 (% total number people)* | 12.7 (11.9–13.6) | 12.9 (11.5–14.4) | 18.0 (16.0–20.2) | 20.7 (19.1–22.4) |
| Age 5–14 (% total number people)* | 24.4 (23–25.8) | 26.0 (23.5–28.5) | 32.2 (30.9–33.5) | 30.3 (27.1–33.8) |
| Age 15–49 (% total number people) * | 51.0 (48.1–54.0) | 48.3 (44.2–52.5) | 41 (37.5–44.5) | 41.1 (38.6–43.6) |
| Age 50 + (% total number people) | 11.9 (9.0–15.6) | 12.8 (11.2–14.6) | 8.8 (6.8–11.4) | 7.9 (6.5–9.7) |
| School enrollment (% enrolled amongst ages 7–13)* | 86.3 (82.9–89.2) | 75.9* (69.3–81.4) | 74.3 (65.5–81.5) | 61.9* (53.7–69.5) |
| School enrollment (% enrolled amongst ages 14–17) | 61.3 (45.0–75.5) | 58.5 (49.3––67.1) | 68.1 (60.6–74.8) | 61.4 (54.4–67.9) |
| Mean years edu for head of household* | 6.5 (5.9–7.1) | 6.9 (6.1–7.8) | 5.0 (4.4–5.6) | 6.0 (5–7.1) |
Note: Asterisks in the left column indicate statistically significant differences between study zones in 2013. Asterisks on 2015 values indicate statistically significant differences between years within study zones. Statistical significance is determined by a P value of < 0.05.
Eligibility and programme effectiveness
Indicators of eligibility and programme effectiveness are summarized in Table 2. In the first and second evaluation rounds of SNP, 42.1% (95% CI 37.1–47.2) and 44.2% (95% CI 41.1–47.4) of households in the intervention area had one or more children enrolled in a SNP-eligible grade.
Indicators of eligibility and programme effectiveness and their design-adjusted 95% CIs
| Intervention Zone | ||
|---|---|---|
| 2013 | 2015 | |
| Households with 1+ children enrolled in an SNP-eligible grade (%) | 42.1 (37.1–47.2) | 44.2 (41.1–47.4) |
| Households with 1+ children enrolled in an SNP-eligible grade reporting children brought home a net (%) | 87.1 (77.6–92.9) | 89.3 (85.4–92.3) |
| Households with 1+ children enrolled in an SNP-eligible grade reporting children brought home a net, also reporting a net was given away (%) | 1.4 (0.4–5.2) | 7.2* (4.7–11.1) |
| Percent of all nets that are from SNP (%) | 16.6 (14.1–19.5) | 31.4* (29.0–33.8) |
Note: Asterisks on 2015 values indicate statistically significant differences between years within study zones. Statistical significance is determined by a P value of < 0.05.
Of those households that had at least one child in an eligible grade, 87.1% (95% CI 77.6–92.9) in 2013 and 89.3% (95% CI 85.4–92.3) in 2015 reported that a net was brought home from SNP. Few households (1.4%; 95% CI 0.4–5.2) reported that they donated a SNP net to a person in another household in 2013; however, these donations were significantly more common in the second round (7.2%; 95% CI 4.7–11.1; P ‘for difference’ = 0.014).
Seventeen percent (95% CI 14.1–19.5) of all nets present in households in the intervention area in 2013 were reported to be acquired through SNP. By 2015 this proportion increased significantly to 31.4% (95% CI 29.0–33.8; P ‘for difference’ < 0.001).
Ownership, use and access
Results on ownership, use, and access are reported in Table 3 and Figure 3. Ownership of at least one net in 2013, regardless of insecticidal status, was 94.7% (95% CI 89.5–97.4) in the intervention area after SNP1 and 88.4% (95% CI 86.5–90.1) in the control area (P ‘for difference’ = 0.036). Ownership of at least one LLIN in 2013 was 76.1% (95% CI 70.8–80.7) in the intervention area and 78.6% (95% CI 74.4–82.3) in the control area and dropped significantly in the control area to 65.4% (95% CI 59.5–71.0) in 2015 (P < 0.001). The percent of households with at least one LLIN per two people in 2013 was 44.4% (95% CI 38.1–50.8) in the intervention area and 23.0% (95% CI 19.4–26.9) in the control area (P‘for difference’ < 0.001) and dropped significantly in the control area to 15.0% (95% CI 10.6–20.8) in 2015 (P = 0.034).
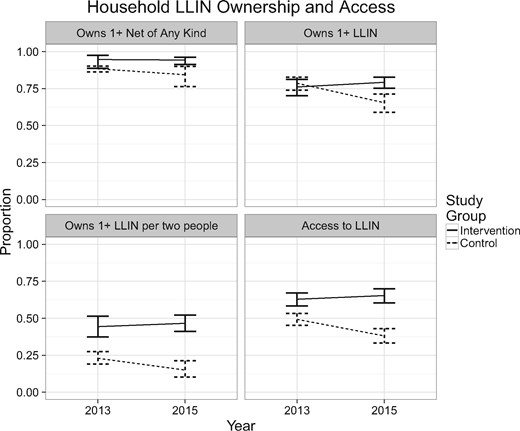
Ownership and access by zone and year with design-adjusted 95% confidence interval bars
Ownership, use, and access indicators and their design-adjusted 95% CIs
| Intervention Zone | Control Zone | |||
|---|---|---|---|---|
| 2013 | 2015 | 2013 | 2015 | |
| Household owns 1+ net of any kind (%)* | 94.7 (89.5–97.4) | 94.3 (91.5–96.2) | 88.4 (86.5–90.1) | 84.4 (77.0–89.7) |
| Household owns 1+ LLIN (%) | 76.1 (70.8–80.7) | 79.3 (75.4–82.6) | 78.6 (74.4–82.3) | 65.4* (59.5–71.0) |
| Household owns 1+ LLIN per two people (%) * | 44.4 (38.1–50.8) | 46.6 (41.3–52.0) | 23.0 (19.4–26.9) | 15.0* (10.6–20.8) |
| Household owns 1+ non-SNP LLIN (%) * | 62.3 (54.1–70.0) | 55.2 (51.1–59.1) | 78.6 (74.4–82.3) | 65.4* (59.5–71.0) |
| Total pop under LLIN last night (%) * | 44.7 (40.5–49.0) | 57.1* (52.2–61.8) | 35.9 (30.3–42.0) | 42.9 (36.8–49.3) |
| With access under LLIN last night (%) | 60.0 (55.5–64.3) | 73.6* (70.0–76.9) | 51.3 (38.7–63.8) | 72.6 (65.7–78.6) |
| Under 5 under LLIN last night (%) | 48.6 (39.3–58.1) | 56.4 (47.9–64.5) | 47.2 (39.7–54.8) | 56.4 (45.7–66.6) |
| Pregnant women under LLIN last night (%) | 41.6 (23.9–61.7) | 53.6 (43.2–63.6) | 35.1 (19.0–55.5) | 39.8 (25.0–56.7) |
| Total population with access to LLIN (%) * | 62.9 (58.9–66.8) | 65.4 (60.6–69.8) | 49.3 (45.7–52.9) | 38.1* (33.6–42.7) |
Note: Asterisks in the left column indicate statistically significant differences between study zones in 2013. Asterisks on 2015 values indicate statistically significant differences between years within study zones. Statistical significance is determined by a P value of < 0.05.
In 2013, 44.7% (95% CI 40.5–49.0) of people in the intervention area and 35.9% (95% CI 30.3–42.0) in the control area slept under a LLIN the previous night (P ‘for difference’ = 0.030). In 2015, this indicator increased to 57.2% in the intervention area (P < 0.001). For those with access to a net in their household, net use the previous night rose significantly from 60.0 to 73.6% in the intervention area and rose significantly from 51.3 to 72.6% in the control area. LLIN use the previous night for children under age 5 in 2013 was ∼48% in both areas and increased to ∼56% in 2015, although this increase was not statistically significant. Only 41.6% (95% CI 23.9–61.7) and 35.1% (95% CI 19.0–55.5) of pregnant women in the intervention area and control area, respectively, slept under an LLIN the previous night in 2013. This indicator rose in 2015 to 53.6% (95% CI 43.2–63.6) in the intervention area and rose only slightly to 39.8% (95% CI 25.0–56.7) in the control area, though these changes were not statistically significant.
The proportion of the population with access to an LLIN within their household was significantly higher in the intervention area than in the control area evaluation districts in 2013 (62.9% [95% CI 58.9–66.8] compared with 49.3% [95% CI 45.7–52.9]; P ‘for difference’ = 0.001). Between the 2013 and 2015 surveys, the control area evaluation districts experienced a significant fall in access to 38.1% (95% CI 33.6–42.7; P ‘for difference’ = 0.001) while intervention area did not experience a significant change between the two surveys.
Equity
Figure 4 summarizes ownership of at least one LLIN and of at least one SNP LLIN per household by wealth quintiles and study areas in 2015. No differences in equity were observed between areas in 2013. In 2015, the difference in LLIN ownership between the highest and lowest wealth quintiles in the control area was statistically significant (P = 0.013). In the intervention area, there was no significant difference between the highest and lowest wealth quintiles in either LLIN or SNP-LLIN ownership.
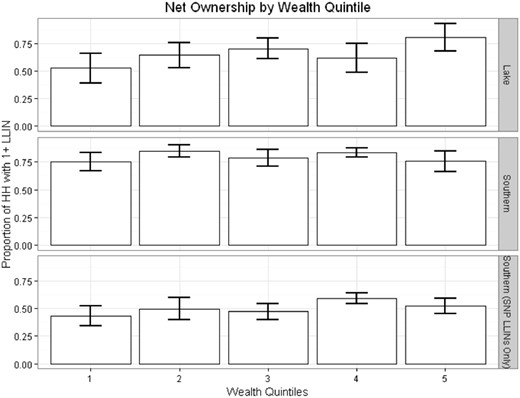
Ownership of 1+ LLIN and 1+ SNP LLIN by wealth quintile and zones in 2015. Error bars represent 95% confidence intervals
Who is using which nets?
In the intervention area, SNP-sourced nets constituted a large portion of all LLINs used the previous night in each age group under 40 (Figure 5). Even among older age groups a substantial portion slept under LLINs from the school programme. This indicates that LLINs from the SNP were not used only by direct recipients, but also by many other household members. Nonetheless, SNP nets were utilized more extensively by school-aged children than by other groups, and those over 60 years of age still relied extensively on campaign sourced LLIN.
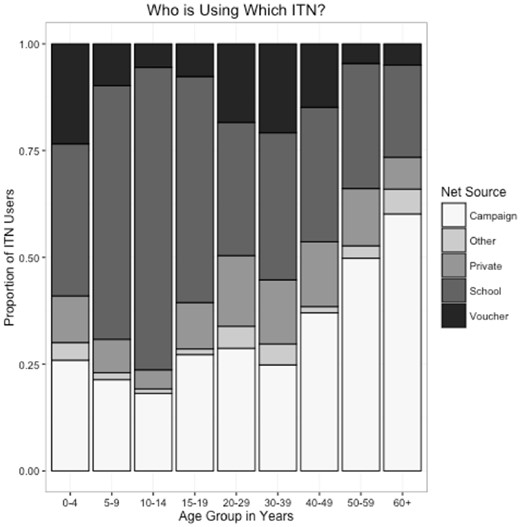
Distribution of net type use by age group amongst people using a net the previous night in 2015
Mixed-model analysis of ownership and access
Table 4 presents the results of survey-adjusted regression models on each of the four outcomes pertaining to ownership and access representing the change in the odds of the given outcome between year 2013 and 2015. There was no statistically significant change indicated for any of the ownership and access indicators in the intervention area from year 2013 to 2015 (Table 4, right column). In contrast, each of the LLIN indicators exhibit statistically significant drops in coverage in the control area (Table 4, left column). For example, the odds of owning at least one LLIN in the intervention area does not change significantly in the intervention area from year 2013 to 2015; however, the odds of ownership drop to 51% (95% CI 0.36–0.74) of 2013 levels by 2015 in the control area (P = 0.001). Restricting these analyses only to the panel evaluation wards present in both evaluations did not appreciably change the results.
Model estimated pre-post change reported as odds ratios
| Outcome | Model-estimated pre-post change (odds ratio) | Difference (ratio) | |
|---|---|---|---|
| Intervention group | Control group | ||
| Owns 1+ net of any kind | 0.94 (0.38–2.28) | 0.71 (0.41–1.21) | 1.32 (0.47–3.73) |
| Owns 1+ LLIN | 1.2 (0.84–1.72) | 0.51* (0.36–0.74) | 2.33* (1.4–3.88) |
| Owns 1+ LLIN per two people | 1.09 (0.78–1.54) | 0.59 (0.37–0.95) | 1.85* (1.03–3.31) |
| Access to LLIN | 0.97 (0.77–1.23) | 0.66* (0.52–0.84) | 1.47* (1.04–2.07) |
Note: Difference in differences reported as ratio of odds ratios in right column. Asterisks indicate statistical significance. Statistical significance is determined by a P value of < 0.05.
Factors associated with reach of SNP
A number of household-level characteristics were hypothesized to have an impact on the reach of the SNP programme. Differences in these characteristics between houses with and without a SNP net in the Southern zone in 2015 are summarized in Table 5. Household size and the presence of children of either primary or secondary school age were all positively associated with SNP net ownership (P ≤ 0.001, <0.001, 0.001, respectively). Household ownership of at least one non-SNP LLIN per two people was negatively associated with SNP net ownership (P < 0.001).
Household characteristics and their design-adjusted 95% CI, by SNP net ownership status for households in the Intervention zone in 2015
| Outcome | Ownership of 1+ SNP net | |
|---|---|---|
| Does not own (n = 777) | Does own (n = 771) | |
| Mean Household Size * | 3.4 (3.2–3.6) | 4.8 (4.6–4.9) |
| Household has Electricity (%) | 33.1 (23.4–44.5) | 38.4 (28.9–48.9) |
| Household has 1+ Non-SNP LLIN per two people (%) * | 34.2 (29.3–39.5) | 16.0 (10.8–23.1) |
| Households has 1+ individual of primary school age (%) * | 27.6 (23.5–32.1) | 77.5 (72.3–82.0) |
| Households has 1+ individual of secondary school age (%) * | 21.4 (15.3–29.1) | 37.6 (33.9–41.4) |
| Households has 1+ individual under age 5 (%) | 47.2 (40.6–53.9) | 48.6 (41.5–55.7) |
| Households has 1+ individual age 50 + (%) | 40.5 (34.1–47.3) | 42.7 (38.8–46.7) |
| Mean years education for head of household | 6.5 (5.6–7.3) | 7.4 (6.3–8.4) |
Note: Asterisks on outcome descriptions indicate statistically significant differences between groups. Statistical significance is determined by a P value of < 0.05.
Results of multivariate mixed-effects logistic regression assessing the relationship between household-level SNP net ownership status and the selected predictors using data from 1543 households in the intervention area in 2015 are presented in Table 6.
Results of multivariate mixed-effects logistic regressions predicting household ownership of at least one LLIN from SNP in the Intervention zone in 2015
| Predictor (unit for odds ratio) | Odds ratio for unit increase | 95% CI | P value |
|---|---|---|---|
| Ward-level school enrollment among children ages 7–13 (10%) | 1.2 | 1.1–1.3 | <0.001 |
| Household has 1+ Non-SNP LLIN per two people (Yes/No) | 0.5 | 0.4–0.6 | <0.001 |
| Household has 1+ primary school age child (Yes/No) | 8.9 | 6.9–11.4 | <0.001 |
| Household has 1+ secondary school age child (Yes/No) | 2.5 | 1.9–3.3 | <0.001 |
Note: Random intercepts specified for ward. Statistical significance is determined by a P value of < 0.05. Model AIC = 1635.7. n = 1543. Note that the Odds Ratio for ward-level enrollment is interpreted as a change in odds for every 10% point increase in enrollment (i.e. 13–23%).
The presence of a primary school age child dominated as a predictor of SNP net ownership. A household with at least one primary school age child had 8.9 times the odds of owning a SNP net (95% CI 6.9–11.4, P < 0.001). The presence of a secondary-school age child was also strongly associated with SNP net ownership (OR = 2.5, 95% CI 1.9–3.3, P < 0.001). The next most influential predictor was whether or not the household had at least one non-SNP LLIN per two people. Such households had half of the odds of owning at least one SNP net as compared with households that didn’t have enough non-SNP nets to provide LLIN access to the entire household (OR = 0.5, 95% CI 0.4–0.6, P < 0.001). Ward-level school enrollment among children ages 7–13 also had a significant and positive effect on SNP LLIN ownership, increasing the odds of ownership by a factor of 1.2 for every 10% point increase (i.e. 70–80%) in enrollment (OR = 1.2, 95% CI 1.1–1.3, P < 0.001).
Net redistribution
Households with at least one non-SNP LLIN per two people were more likely to report that a SNP net which was brought home in 2015 was donated to another household (14.0%, n = 88, 95% CI 6.6–28.0), as compared with households without (6.1%, n = 527, 95% CI 3.9–9.0; P ‘for difference’ = 0.025).
Discussion
This study found that LLIN coverage in areas which received SNP distributions remained stable following two rounds of SNP net distribution. During the same period LLIN ownership, especially of enough nets to ensure household level access, fell significantly in non-intervention evaluation areas. These results demonstrate that the SNP delivery may be sufficient to maintain stable and equitable LLIN coverage following a mass distribution of LLINs. They additionally suggest that within programme areas, inter-household redistribution was limited (though higher following the second round of SNP than following the first), but likely tied to the donating household’s need for the net (i.e. whether or not the household had one or more LLINs for every two people without their SNP nets). Although there were some substantial contributions of other factors to household level probability of LLIN receipt through SNP, the most important factors were the presence of a school age child in the household, local school enrollment levels, as well as ownership of at least one non-SNP LLIN per two people in the household. Intra-household redistribution was high with significant numbers of household members in older as well as pre-school age groups utilizing SNP nets this was a goal of the programme.
Important to consider is the SNP was conceived and planned as a complement to the already existing TNVS distribution system which supplied nets to expectant mothers, and households with infants conditional on mothers’ attendance to ante-natal care or the child’s attendance to EPI services. Although the TNVS alone did not supply enough nets to achieve or maintain universal coverage, it was the combination of both SNP and TNVS which was meant to maintain universal coverage after the UCC of 2010–11. Unfortunately, the TNVS was discontinued in 2014 and no system has yet replaced it in Tanzania. Further, the initial implementation of SNP was delayed substantially after the UCC meaning that initial achievements in coverage with UCC were lost during the gap between the campaign and the rollout of the SNP programme.
Although the results indicate that the SNP programme has successfully maintained coverage over a short time period in southern Tanzania, absolute coverage, especially for adequate numbers of LLINs in the household, remained lower than national targets (the NMCP’s 2016 target for the percentage of households with at least one LLIN for every two people was 80%). As such, the results here need to be interpreted with cautious optimism. Maintenance of coverage can occur at any level with maintenance of lower level coverage requiring far fewer LLIN inputs than maintenance of universal coverage. Had the SNP begun more rapidly following the last nationwide mass distribution it is possible that coverage levels might have been maintained at a higher level. Although the SNP system has been successful at maintaining coverage over the short term, it has not been evaluated at high levels of coverage for adequate numbers of LLINs per household nor for the long term. Continued evaluation following the third and fourth rounds of SNP should provide additional evidence as to the long term sustainability of LLIN coverage supplied through this mechanism.
The SNP is one of several ‘keep-up’ strategies being tested in sub-Saharan Africa to maintain coverage after mass distribution campaigns have been employed. These include voucher schemes such as the TNVS, commercial sector sales, social marketing, ANC-EPI distribution and many others. Many of these approaches alone have not delivered enough nets to maintain high levels of LLIN coverage and use, though in some cases combinations of channels have provided promising results (Lengeler and deSavigny 2007). Distribution of LLINs through schools provides a potential channel that can at minimum form a portion of a combined ‘keep-up’ strategy.
Dissemination of health products and health education through schools has been a successful strategy for public health intervention and education in a variety of diverse settings such as school-based trachoma and helminth control in the Tanga region of Tanzania (Wedner 2000; Guyatt et al. 2001), a school-based deworming programme in Zanzibar (Stoltzfus et al. 1998), and the Kenyan School Feeding Programme (Khatete et al. 2013). Each of these programmes was associated with significant gains in health and health knowledge in their respective regions as well as favourable feedback from school staff. The Kenyan School Feeding Programme also reported significant gains in school attendance. In the USA, the National School Lunch Programme has been used as a tool for a variety of goals, from ‘reducing malnutrition in the post-World War II era to a modern emphasis on reducing overweight and obesity’ (Peterson 2014). These examples show the potential for school-based health education and distribution programmes to make improvements in health in communities. With large school networks already in place, schools have the potential to reach large portions of a population, possibly with less cost and logistical burden than if a programme were implemented outside of existing infrastructure.
The evaluation design provides significant strengths through the use of repeated cross-sections, a panel design at the community level and the inclusion of comparison districts which did not receive the SNP intervention. It also has some limitations, these include the fact that the two surveys were carried out during different seasons, compromising the ability to compare some outcome indicators over time. This is especially true of those indicators for LLIN use. It is well established that use of nets varies by season, likely in response to temperature fluctuation and nuisance mosquito biting patterns (Pulford et al. 2011; Moiroux et al. 2012). The study here clearly showed increased use in the Lake zone during survey round two despite the lower coverage of ITNs. This is likely a result that the second round survey was conducted during the rainy season and thus captured a higher use rate per LLIN. There were also some differences between the intervention and control areas. Nonetheless, the investigators prioritized the similarities in terms of non-SNP current and past LLIN distributions, as well as geographical distance in order to avoid contamination of the control area by the intervention. Additionally, the second round survey was conducted 9 months after the completion of the second distribution whereas the first round survey was conducted immediately following the first distribution. Assuming that net ownership might decline over time in the absence of a net distribution, our analyses presented above may be conservative in assessing whether the SNP can effectively maintain coverage.
Conclusions
The SNP, implemented in the Southern zone of Tanzania, appears capable of maintaining equitable LLIN coverage levels in the short term. Evaluating the programme in the following years will be important for determining the programmes capability to maintain long-term coverage. The SNP targets primary and secondary school age children and therefore systematically misses households in which these populations are not present. Concurrent use of additional channels must therefore be considered to maintain coverage across all household types.
Acknowledgements
We would also like to thank George Greer for constructive comments on an early version of this article.
Funding
This work was supported by the President's Malaria Initiative via the US Agency for International Development/Tanzania (USAID/TZ) under the terms of an inter-agency agreement with Centers for Disease Control and Prevention (CDC) through the United States Agency for International Development/Tanzania (USAID/TZ) cooperative agreement with the MEASURE Evaluation consortium, under the associate cooperative agreement No. AID-621-LA-14-00001 titled ‘Measure Phase III—Strengthening the monitoring, evaluation and research capacity of the community health and social service programmes in the United Republic of Tanzania’. The opinions expressed herein are those of the authors and do not necessarily reflect the views of the President's Malaria Initiative via the US Agency for International Development, or other employing organizations or sources of funding.
Conflict of interest statement. None declared.
References
Tanzania Commission for AIDS (TACAIDS), Zanzibar AIDS Commission (ZAC), National Bureau of Statistics (NBS), Office of the Chief Government Statistician (OCGS), and ICF International 2013. Tanzania HIV/AIDS and Malaria Indicator Survey 2011–12. Dar es Salaam, Tanzania: TACAIDS, ZAC, NBS, OCGS, and ICF International.
Author notes
These authors contributed equally to this work.
